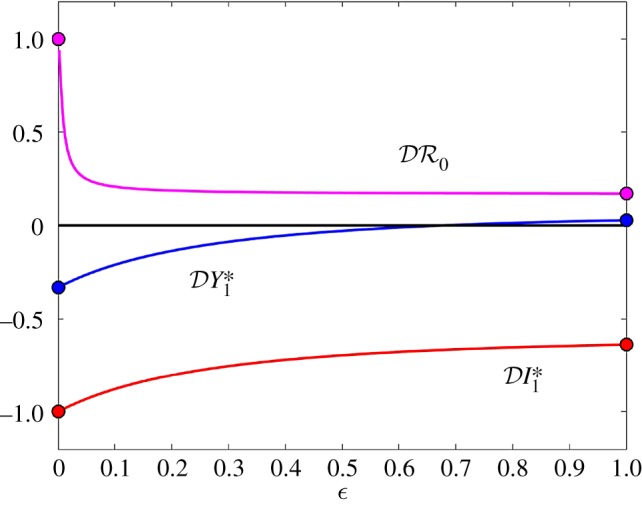
Figure 3.

The elasticity of infection prevalence  (blue), infection abundance
  (red) and basic reproduction number
  (magenta) as functions of ε. Transmission of infection is density-dependent with β11 = 3.750, β22 = 3.106 and
  . Other parameter values as in figure 1. Circles at ε = 0 and ε = 1 are calculated from formulae in §§2.2 and 2.3, respectively. (Online version in colour.)
