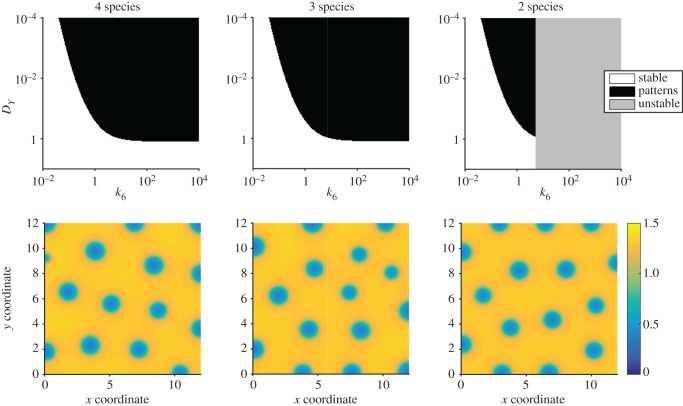
Figure 3.
Turing pattern analysis for a reaction network from Turing [8]. (a–c) Bifurcation diagrams for 4- (3.8), 3- (3.10) and 2-species (3.12) systems. In all cases, the parameter values used were k1 = 2, k2 = 0.2, k3 = 0.01, k4 = 0.08, k5 = 0.04, k7 = 2, cTot = 6, DX = 1. (d–f) Stable patterns formed by species X in the 4- (3.8), 3- (3.10) and 2-species (3.12) systems, respectively. In all cases, the parameter values used were as in (a–c) but additionally k6 = 3.37, DY=0.04, domain length = 6.

