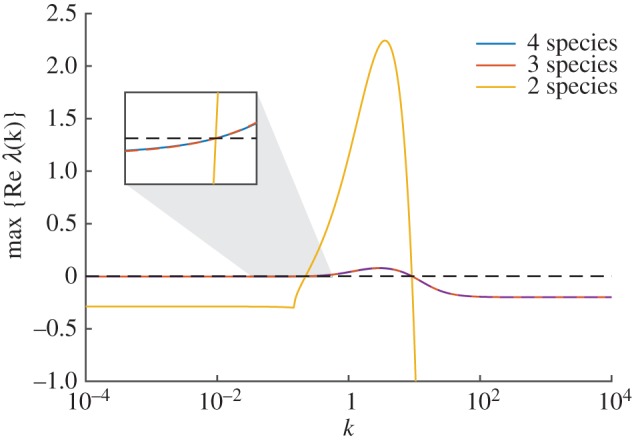
Figure 4.

Dispersion relations for the reaction network from Turing [8]. Dispersion relations are shown 4- (3.8), 3- (3.10) and 2-species (3.12) systems (blue, red and yellow, respectively). Although the plots are different in general, all three cross the zero line at the same points. An inset plot shows the crossing of the zero line at the lower value of k. Parameter values are as in figure 3.
