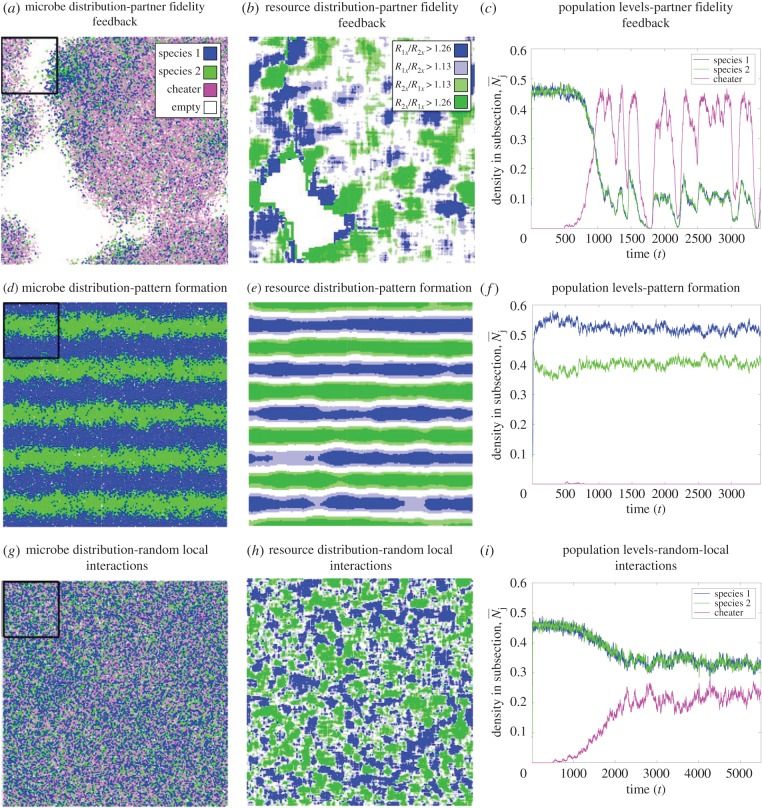
Figure 4.
Microbe and resource distribution under each mechanism. (a) The distribution of microbes with localized interactions (dres = 9) and dependable associations (dmic = 7). (b) The relative density of resources at each site in a. Green and blue areas (lighter and darker areas if in greyscale) indicate that species 1 and 2 has an advantage, respectively (i.e. because b0/b2 ≈ 1.13). (c) Temporal dynamics in the black square in a. (d–f) are analogous to a–c, but with diffuse interactions (dres = 25) and but dependable associations (dmic = 3). Cheaters could not persist here. (g–i) are analogous to a–c, but with localized interactions (dres = 3) and random associations (dmic = 15). Parameters are the same as figure 2. (Online version in colour.)

