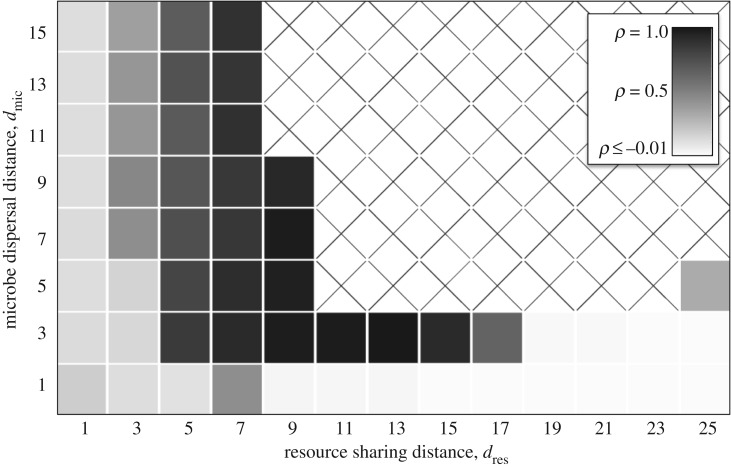
Figure 6.
Whether cross-feeders and cheaters partition sites. We correlated the cheater's reproductive rate (B0x) with each cross-feeder's reproductive rate (B1x and B2x) across all sites for each community in microbes in figure 2. Cells display the average of both correlations. Values close to 1 indicate that sites were generally good or bad for every species. Values close to 0 indicate that many sites were good for a cross-feeder but bad for the cheater.

