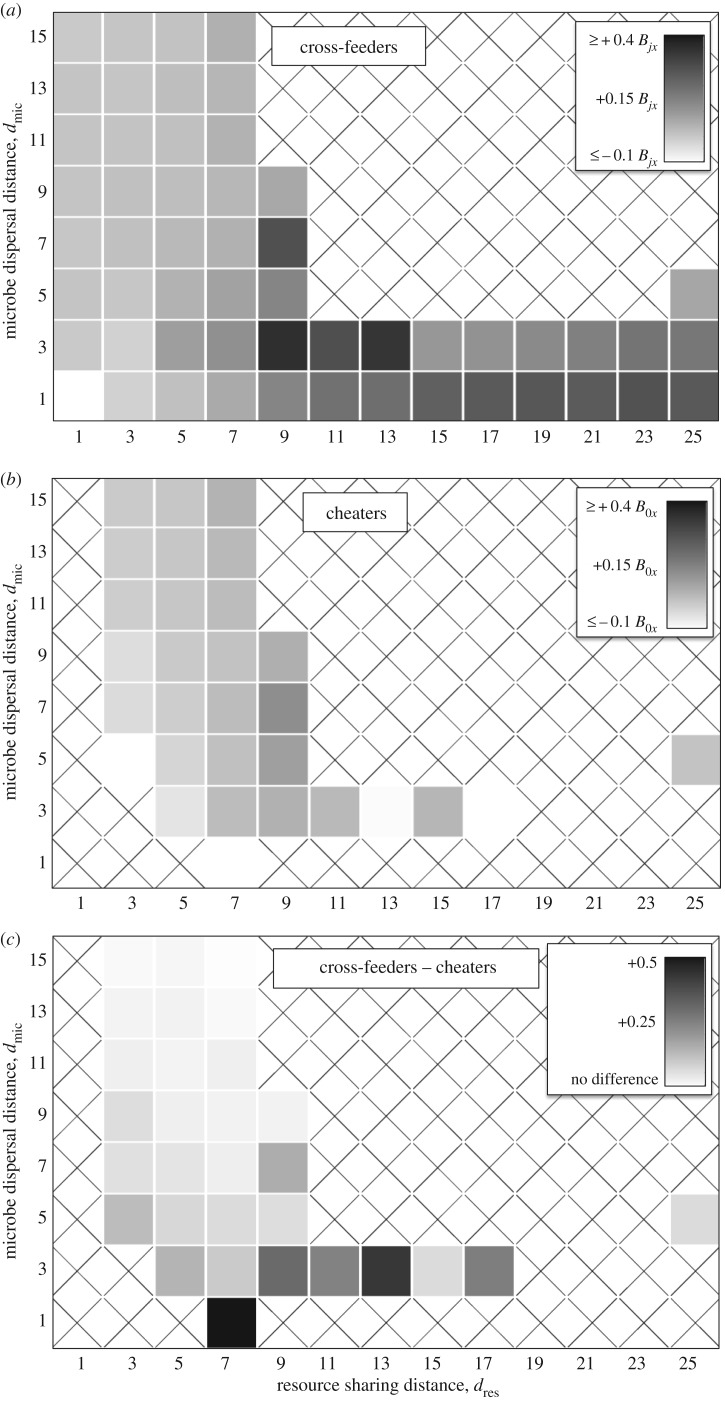
Figure 7.
Whether microbes are near the resources they need. (a) We calculated the reproductive rate of each cross-feeder at each site (i.e. B1x or B2x), using the communities in figure 2. We subtracted the mean of this value across all sites from the mean in only sites where that microbe was found. If this difference was positive, then randomly moving a microbe would reduce its reproductive rate. Each result is the average value for both cross-feeders. (b) We calculated the same value for each cheater (i.e. B0x). Communities without cheaters are labelled with an X, because we could not measure the effect of sites they occupy if they are absent. (c) We subtracted the values in b from those in a. When that difference was positive, it indicated that the cross-feeders were more likely to be in favourable locations, compared to the cheater.

