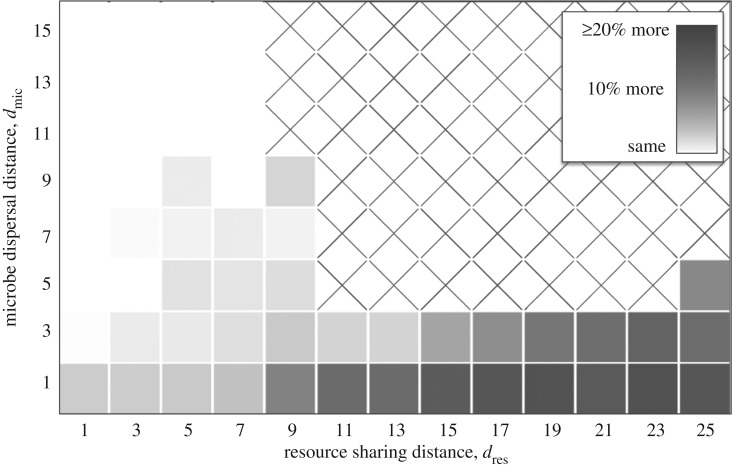
Figure 9.
Amount that a cheater would benefit if spatial structure was disrupted. We calculated the cheater's average reproductive rate (B0x, averaged over all sites) for each community in microbes in figure 2. We then randomly rearranged the microbes, and re-measured the mean of B0x. The heat map shows how much the mean of B0x increased in the rearranged community, and thus quantifies how much spatial structure hindered the cheaters.

