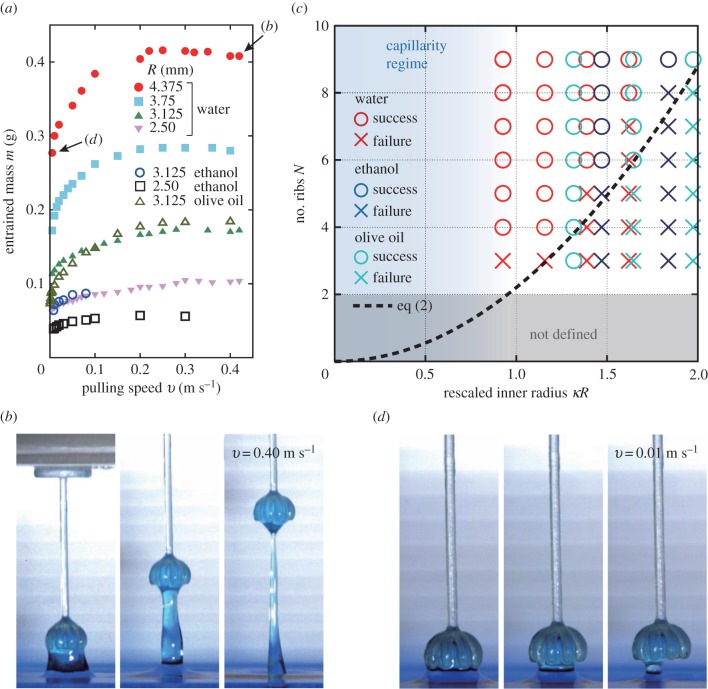
Figure 3.
(a) Extracted mass, m, as a function of withdrawal velocity, v, for increasing radius, R, with N = 9 ribs in all cases. (b,d) Snapshots of typical water withdrawals for (b) v = 0.4 m s−1, and (d) v = 0.01 m s−1. The water was dyed with food colouring to enhance visualization. The corresponding mass data are indicated in (a) by the arrows. (c) Grabbing phase diagram constructed experimentally in the (R, N)-plane for different liquids (water, ethanol and olive oil) by fixing the Weber number at We = 6.8. Symbols indicate successful (○) and failed grabbings (×). The regime of capillarity corresponds to κR < 1. The dashed line is the theoretical prediction for the phase boundary given in equation (3.2). (Online version in colour.)

