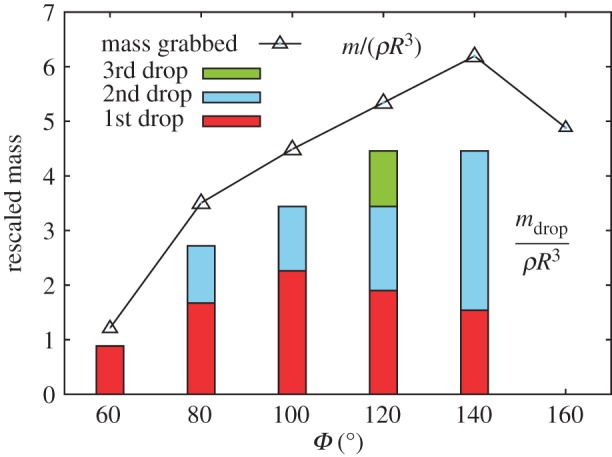
Figure 6.

Dripping experiment with viscous olive oil. The rescaled (maximum) grabbed mass, m/ρR3 (open symbol) and the rescaled mass dropped at the critical tilting, mdrop/ρR3 (bar), plotted as a function of the shape parameter, Φ, for R = 3.125 mm with N = 9. The red, blue and yellow bars represent the amount of oil at the first, second and third dripping event during a sufficiently slow increase of the tilting angle. (Online version in colour.)
