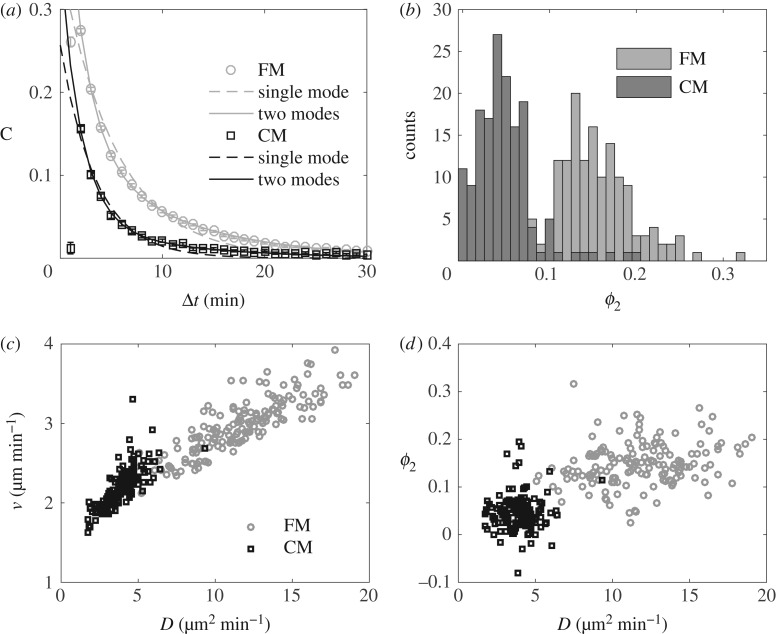
Figure 2.
Random motion with two relaxation times. (a) VDACFs of AX2 cells in FM (light circles) and CM (dark squares), and best mono-exponential (dashed lines) and bi-exponential (solid lines) fits. In both plots, the error bars (smaller than marker size) show the SEM of 156 independent experiments. (b) Distributions of ϕ2 in FM (light grey) and CM (dark grey). (c,d) v and ϕ2 as a function of D in both FM and HCM. In (b–d), each point or count in the histograms corresponds to one experiment.

