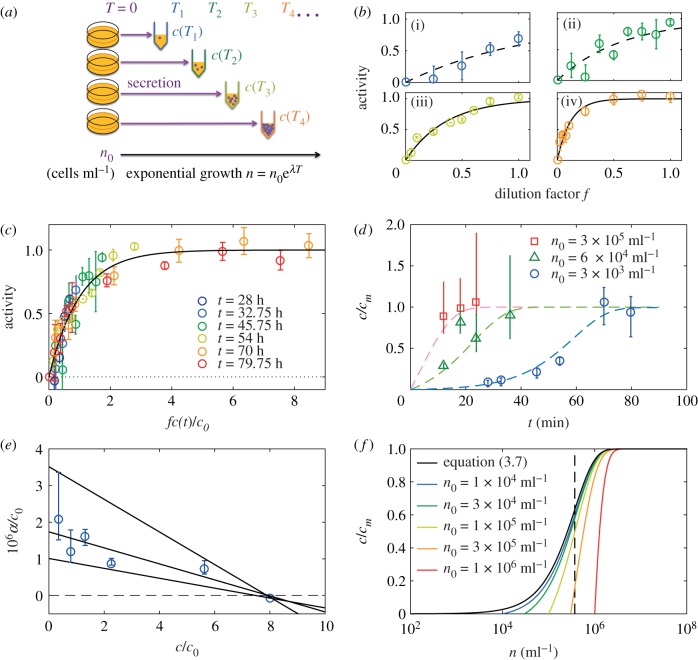
Figure 4.
The QSF secretion is under negative feedback. (a) Principle of the experiment: cell cultures are started at t = 0 in several dishes with a given cell density n0. Then the medium is taken at various times t = Ti, so that it contains QSF at concentration c(Ti). (b(i)–b(iv)) For all media collected at different time points Ti, the activity was measured as a function of the dilution factor f. Same colours as in (c). The black lines represents the  fit. (c) Then all the activity curves were collapsed onto the master curve (black line) to get the relative QSF concentrations, allowing to measure c(t)/c0 for all Ti with the definition c(t)/c0 = 1/f0(t). (d) Computed QSF concentration in time, starting from n0 = 3 × 10³ ml−1 (blue circles), n0 = 6 × 10⁴ ml−1 (green triangles), n0 = 3 × 10⁵ ml−1 (red squares) and theoretical predictions from equation (3.6) (dashed lines, cm = 8c0 for n0 = 3 × 10³
ml−1, cm = 12c0 for n0 = 6 × 10⁴ and 3 × 10⁵ ml−1). The error bars represent the standard deviation (n = 3 independent experiments for each point). (e) Normalized secretion rate α/c0 as a function of the concentration, computed from the c(t) obtained with n0 = 3 × 10³ ml−1. The grey lines show a linear fit (centre) and the bounding straight lines. (f) Theoretical concentration as a function of logn in populations starting from various initial densities n0. The system exhibits a tendency to switch fast from 0 to 1 around n* (dashed vertical line) with a weak sensitivity to n0 (all the curves converge fast to the limit case of equation (3.6), black line).

