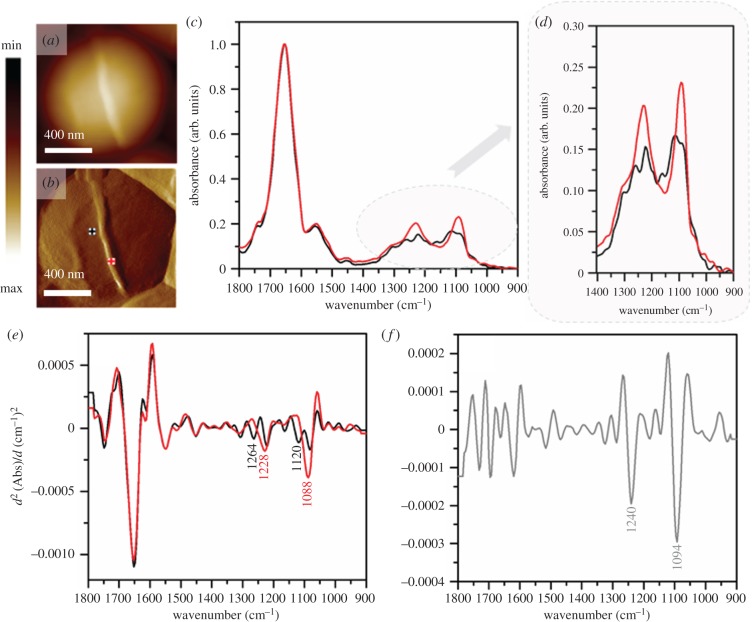
Figure 5.
(a) AFM height and (b) AFM deflection image of the dividing cell collected prior to recording AFM–IR spectra at the marked points, from which spectra were recorded (non-septum in black and forming septum in red). Size of the area imaged by AFM: 1.17 × 1.15 µm. (c,d) Comparison of AFM–IR spectra recorded from septum (red) and non-septum (black) of the S. aureus cell during division in the spectral range (c) 1800–900 cm−1 and (d) 1400–900 cm−1. Spectra were normalized to amide I band. (e) The second derivatives of spectra presented in (c), with marked prominent differentiating bands. (f) The second derivative of a differential spectrum obtained by subtraction of non-septum spectrum (c, black) from the septum spectrum (c, red), with prominent bands marked.

