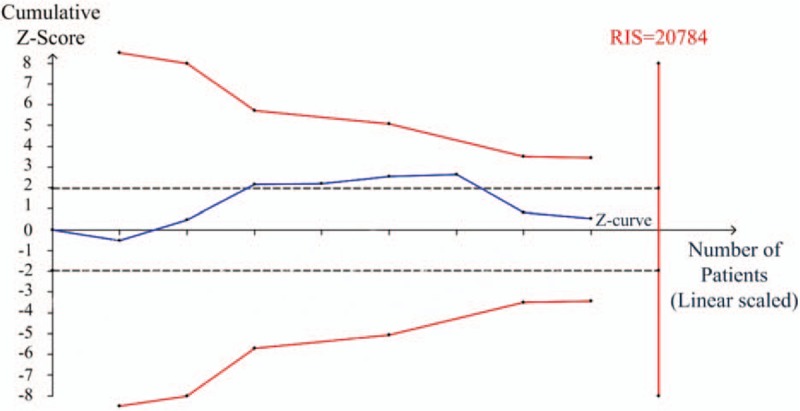
Figure 5.

Trial sequential analysis (TSA) about serum vitamin D insufficient of benign and malignant lesions in female reproductive system. The solid blue line is the cumulative Z-curve. To the left, the red, inward-sloping, solid lines make up the trial sequential monitoring boundaries. To the right, the vertical red line represents required information size (RIS) of this meta-analysis. The black dashed lines represent the conventional statistical boundaries. TSA = trial sequential analysis.
