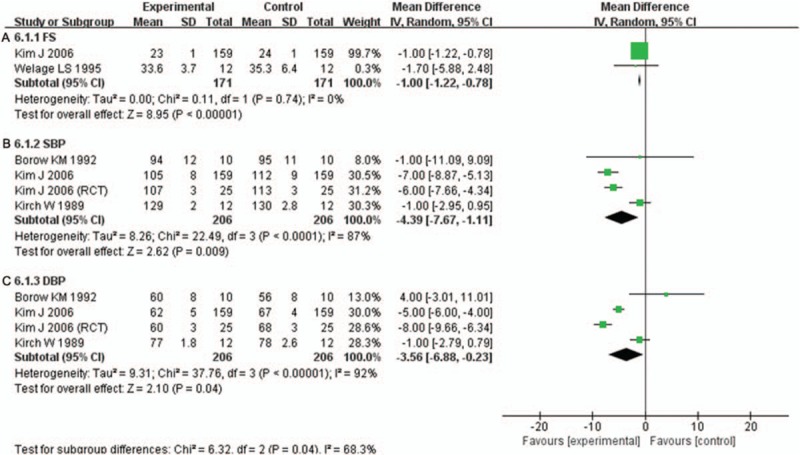
Figure 9.

A. Forest plot for comparison of fraction shorting (FS) between H2RAs and control group. B. Forest plot for comparison of systolic blood pressure (SBP) between H2RAs and control group. C. Forest plot for comparison of diastolic blood pressure (DBP) between H2RAs and control group. H2RAs = Histamine H2 antagonists.
