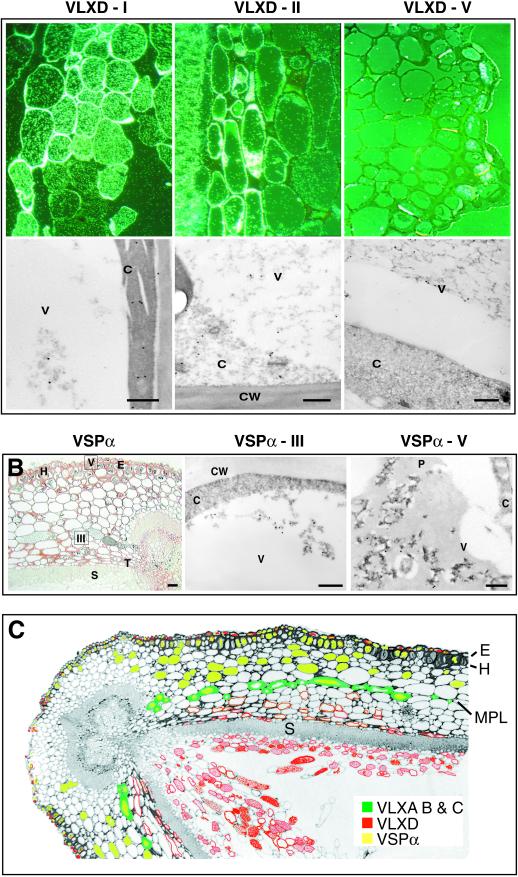
Figure 6.
Light and electron microscopy immunolocalization of VLXD and VSPα in 3-week-old soybean pod walls. A, Upper panels, epipolarized views of regions I (endocarp middle zone), II (mesocarp), and V (exocarp; refer to Fig. 3B) stained with antisera for VLXD. Bar = 50 μm. Lower panels, TEM immunolocalizaton of VLXD at the subcellular level from regions corresponding to those shown in the upper panels. Bar = 500 nm. B, Left, bright field micrograph showing cellular localization of VSPα in pod walls. Bar = 50 μm. Center, TEM immunolocalization of VSPα in region III (mesocarp). Bar = 500 nm. Right, TEM immunolocalization of VSPα in region V (exocarp). Bar = 500 nm. C, False-colored micrograph of a soybean pod wall indicating the immunolocalization patterns for VLXA, VLXB, VLXC, VLXD, and VSPα. P, Phenolics.

