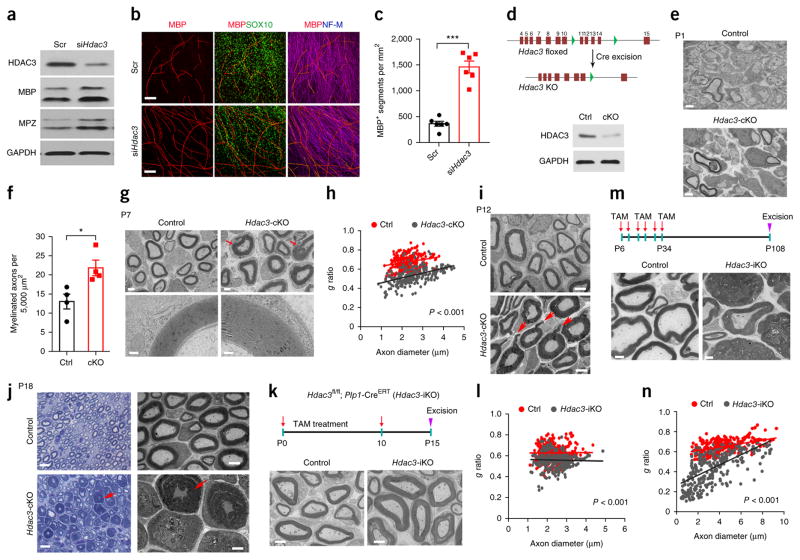
Figure 3.
Hdac3 ablation leads to hypermyelination during peripheral nerve development. (a) Western blots for HDAC3, MPZ, and MBP in co-cultures of DRGs and SCs treated with siHdac3 or scrambled control siRNA (Scr). n = 2 independent experiments. GAPDH served as a loading control. (b) Rat SCs treated with siHdac3 or control siRNA were seeded onto rat DRGs. After 10 d, co-cultures were immunostained for MBP (red), SOX10 (green), and neurofilament-M (blue). n = 6 independent experiments with 10 images for each experiment. Scale bars, 100 μm. (c) Quantification of the number of MBP+ segments per mm2 of area in myelinating co-cultures of DRGs and SCs treated with siHdac3 or control siRNA. Data are presented as mean ± s.e.m.; n = 6 independent experiments; two-tailed unpaired Student’s t-test (P < 0.0001, t = 8.79, d.f. = 10). (d) Top, a schematic showing Cre-mediated excision of floxed Hdac3 exons 11–14. Bottom, a western blot of sciatic nerves showing a marked decrease in HDAC3 in Hdac3-cKO mice relative to controls (ctrl) at P21. n = 3 independent experiments. GAPDH served as a loading control. (e) EM analysis of cross-sections of sciatic nerves from control and Hdac3-cKO mice at P1. n = 4 mice per group with 10 images for each mouse. Scale bars, 1 μm. (f) Quantification of the number of myelinated axons per 5,000 μm2 of sciatic nerve from control and Hdac3-cKO mice at P1. Data are presented as mean ± s.e.m.; n = 4 mice per group; two-tailed unpaired Student’s t-test (P = 0.0207, t = 3.114, d.f. = 6). (g) Top, EM analysis of cross-sections of control and Hdac3-cKO sciatic nerves at P7. Arrows indicate regions of thick myelin sheaths in Hdac3-cKO mice. Scale bars, 2 μm. Bottom, high-magnification images of myelin wrapped around axons of similar diameter. n = 3 mice per group with 10 images for each mouse. Scale bars, 0.2 μm. (h) Quantification of g ratios of axons at P7 from control and Hdac3-cKO mice. n = 250 axons from 3 control mice and 252 axons from 3 Hdac3-cKO mice; two-tailed unpaired Student’s t-test (P < 0.0001, t = 19.91, d.f. = 500). (i) Representative electron micrographs of cross-sections of sciatic nerves from control and Hdac3-cKO mice at P12. n = 4 mice per group with 10 images for each mouse. Arrows indicate myelin outfoldings. Scale bars, 2 μm. (j) Representative light microscopy images and electron micrographs of sciatic nerve cross-sections from control and Hdac3-cKO mice at P18. Arrows indicate excessive myelin. n = 4 mice per group with 10 images for each mouse. Scale bars, 10 μm (left) and 4 μm (right). (k) Top, a schematic of tamoxifen (TAM) administration. Tamoxifen was injected i.p. into lactating dams once per day until P10. Sciatic nerves were excised at P15. Bottom, representative electron micrographs of cross-sections of sciatic nerves from control heterozygotes and Hdac3-iKO mice. n = 4 mice per group with 10 images for each mouse. Scale bars, 2 μm. (l) Quantification of g ratios of axons at P15 from control and Hdac3-iKO mice. n = 303 axons from 3 control mice and 305 axons from 3 Hdac3-iKO mice; two-tailed unpaired Student’s t-test (P < 0.0001, t = 11.09, d.f. = 606). (m) Top, a schematic of tamoxifen administration. Mice were treated with tamoxifen from P6 to P10, from P18 to P22, and from P30 to P34. Sciatic nerves were excised at P108. Bottom, representative electron micrographs of cross-sections of sciatic nerves from control and Hdac3-iKO mice. n = 4 mice per group with 10 images for each mouse. Scale bars, 2 μm. (n) Quantification of g ratios for axons at P108 from control and Hdac3-iKO mice. n = 302 axons from 3 control mice and 304 axons from 3Hdac3-iKO mice; two-tailed unpaired Student’s t-test (P < 0.0001, t = 21.79, d.f. = 604). *P < 0.05, ***P < 0.001.

