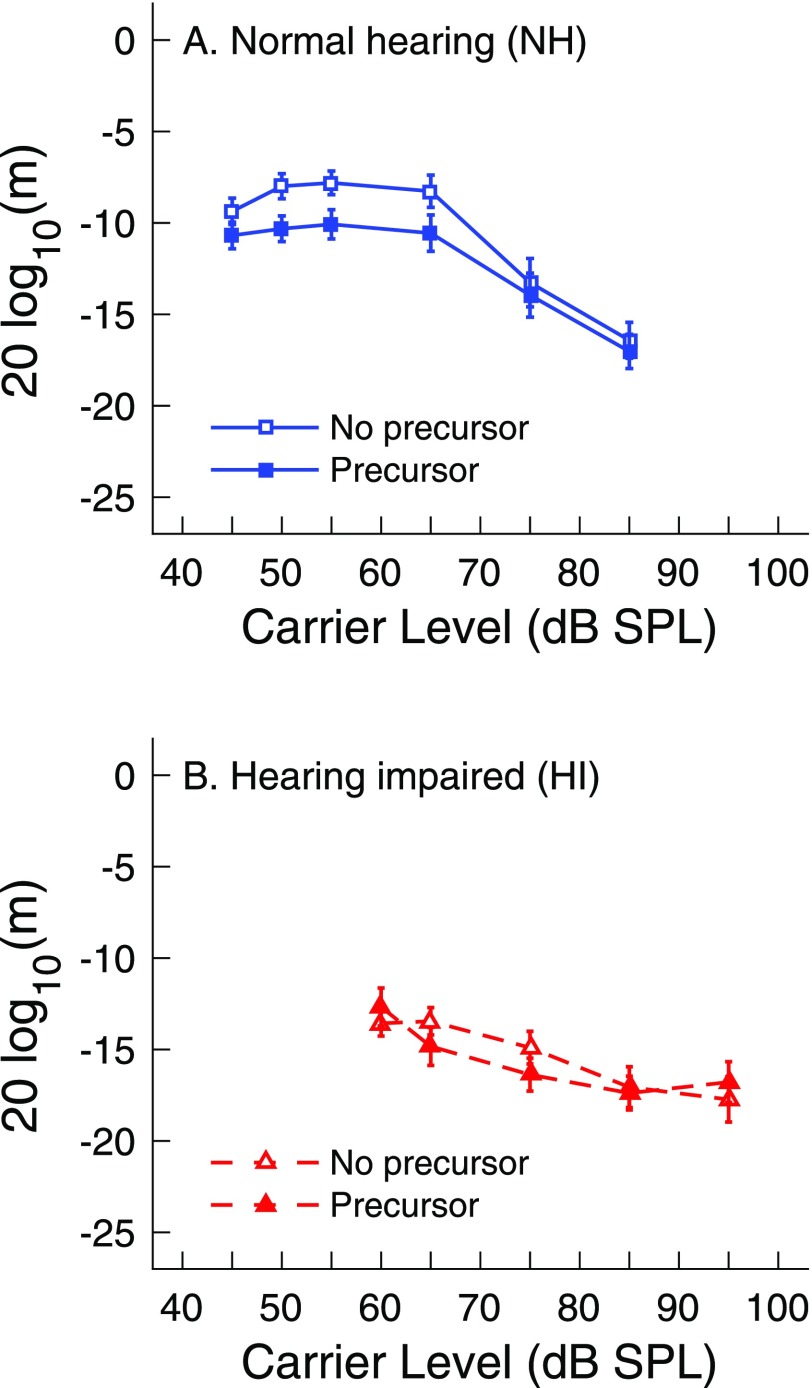
FIG. 3.
(Color online) Average amplitude modulation detection thresholds (m in dB) as a function of carrier level (in dB SPL). Carriers were preceded by silence (no precursor, open symbols) or by a notched-noise precursor (filled symbols) in subjects with NH (panel A) and HI (panel B). Error bars depict ±1 standard error of the mean.

