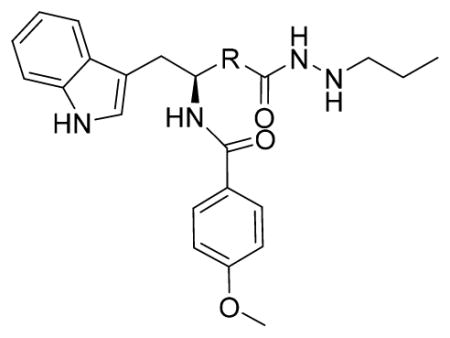
Table 2.
HDAC1, 2, 3, and 6 Inhibitory Activity and in Vitro Antiproliferative Activity of 13e–13h and 18a

| ||||||
|---|---|---|---|---|---|---|
| Compounds No. | R | IC50 (nM) | EC50 (nM, MV4-11 cells) | |||
|
| ||||||
| HDAC1 | HDAC2 | HDAC3 | HDAC6 | |||
| 13b |

|
63.28±10.24 | 287.1±38.2 | 8.50±0.89 | >100000 | 138.7±23.5 |
| 13e |

|
9.54±1.34 | 28.04±4.12 | 1.41±0.57 | >100000 | 34.7±4.2 |
| 13f |

|
80.19±10.29 | 209.0±30.5 | 12.44±15.26 | >100000 | 1254±101 |
| 13g |

|
91.59±15.42 | 191.3±25.3 | 5.205±1.44 | >100000 | 652.7±89.3 |
| 13h |

|
52.77±3.80 | 199.3±10.4 | 12.09±3.21 | >100000 | 1687±239 |
| 18 |

|
28.88±2.78 | 283.3±43.6 | 2.816±0.76 | >100000 | 243.0±48.2 |
IC50 and EC50 values are the mean of at least three experiments ± the standard error of the mean.
