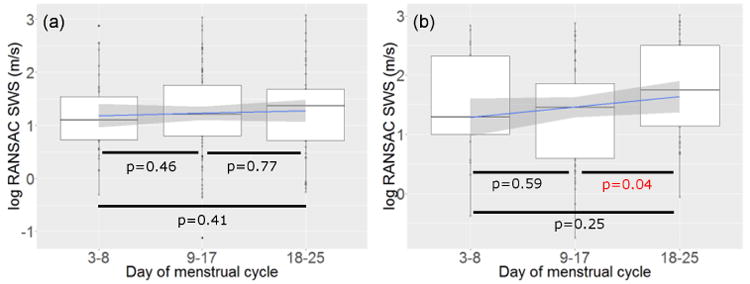
Figure 3.

SWS (log-transformed) vs. day within the menstrual cycle at the (a) anterior side and (b) posterior side. The blue line and shadowed area are the linear smoother and its 95% confidence interval. p values were obtained from the Kruskal-Wallis nonparametric test of statistical significance
