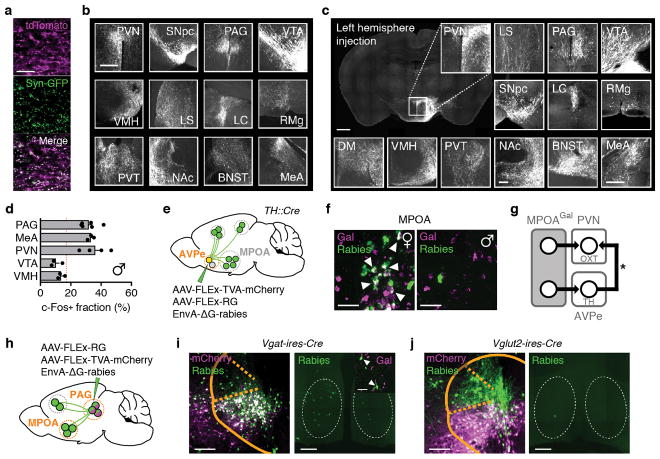
Extended Data Figure 2. MPOAGal projections in males and downstream connectivity.
a, Synaptophysin-GFP (Syn-GFP) labelling of presynaptic sites in MPOAGal projections. b, Representative MPOAGal projections from a virgin male, identified by tdTomato fluorescence. c, Representative MPOAGal projections, identified by tdTomato fluorescence, after viral injection into the left MPOA. d, c-Fos+ fractions of virally labelled MPOAGal projections in fathers (n = 6, 3, 4, 3, 3, respectively, from top). Red line depicts the population average (see ref. 3). Data are mean ± s.e.m. e, Trans-synaptic retrograde rabies tracing from AVPeTH neurons. f, MPOAGal neurons presynaptic to AVPeTH neurons in females (left, arrowheads, 21.4% Gal+, 47/220 neurons, n = 3) and males (right, 16.7% Gal+, 4/24 neurons, n = 2). g, Direct and indirect MPOAGal→PVNOXT connectivity. Asterisk, AVPeTH neurons form excitatory synapses with PVNOXT in females11. h, Conditional monosynaptic retrograde tracing initiated from PAG. i, j, Injection sites with mCherry+ starter neurons in PAG of Vgat-ires-Cre (i, left) or Vglut2-ires-Cre (j, left) mice. Presynaptic, rabies+/Gal+ neurons are detected in MPOA when tracing is initiated from PAGVgat (i, right, arrowheads), but not PAGVglut2 (j, right), neurons. Scale bars, a, 50 μm; b, 250 μm; c, left, 500 and inset, 250 μm; f, 50 μm; i, j, left, 200 μm and right, 250 μm; i, insert, 50 μm.

