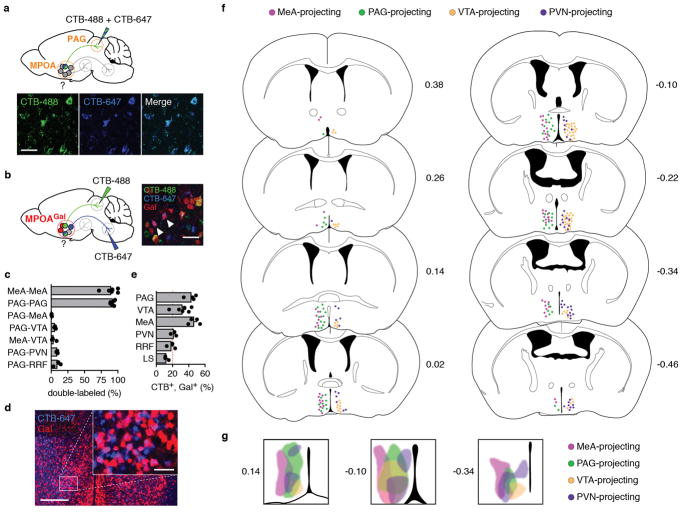
Extended Data Figure 3. MPOAGal projections correspond to largely non-overlapping neuronal subpopulations.
a, Control injection of a 1:1 mixture of CTB-488 and CTB-647 into PAG results in highly overlapping neuron populations in the MPOA (quantification, see c). b, Strategy to determine collaterals between pairwise injected MPOAGal projections in Gal::Cre+/−; loxP-Stop-loxP-tdTomato+/− mice. An example with two double-labelled MPOAGal neurons is shown after injection of CTB-488 into PAG and CTB-647 into VTA (right, arrowheads). c, Quantification of data in a, b. Data are mean ± s.e.m. (n = 6, 6, 3, 3, 3, 3, 3, respectively, from top). d, Representative image from MPOA of Gal::Cre+/−; loxP-Stop-loxP-tdTomato+/− mouse after injection of CTB-647 into PAG. Note high overlap between Gal+ and CTB+ neurons. e, Frequency of Gal+ neurons in individual, CTB-labelled MPOA projections (n = 4, 6, 4, 3, 3, 3, respectively, from top). Red line depicts expected labelling frequency, based on proportion of Gal+ MPOA neurons (~20%, ref. 3). Data in c, e are mean ± s.e.m. f, Distribution of cell bodies corresponding to specific MPOAGal projections. Individual MPOAGal projection areas in Gal::Cre virgin females were injected with Cre-dependent CAV2-FLEx-ZsGreen (see Fig. 2h). Only labelling patterns on the ipsilateral, injected side are shown and only two projection-specific subpopulations per side are displayed for clarity. Distance from Bregma is shown in mm. Mouse brain images in this figure have been reproduced with permission from Elsevier64. g, Zones occupied by MPOAGal cell bodies projecting to MeA, PAG, VTA and PVN in anterior (left), central (middle) and posterior (right) MPOA. Distance from Bregma is shown in mm. Scale bars, a, b, 50 μm; d, 250 μm and inset, 50 μm.

