
Figure 3.
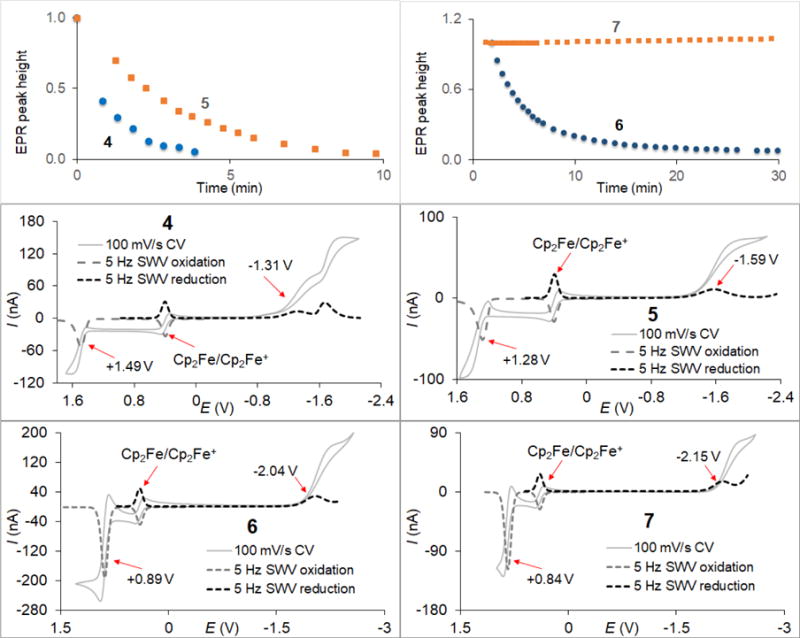
Left upper panel: reduction profiles for 0.005 mM nitroxides 4 and 5 with 0.05 mM ascorbate and 0.13 mM GSH in 25 mM PBS pH 7.4 at 295 K; right upper panel: reduction profiles for 0.7 mM nitroxides 6 and 7 with 14 mM ascorbate and 17.5 mM GSH in 40 mM PBS pH 7.4 at 295 K; middle panels: CV and SWV plots for 4 and 5; bottom panels: CV and SWV plots for 6 and 7. CV had scan rates of 100 mV/s and scan increments of 3 mV; SWV had frequencies of 5 Hz and scan increments of either 2 (oxidation) or 3 (reduction) mV. CV potential scans start at about −0.5 V, then run toward the positive (oxidation) potentials, then go to the negative potentials (reduction), and finally return to the starting point.