Fig. 7.
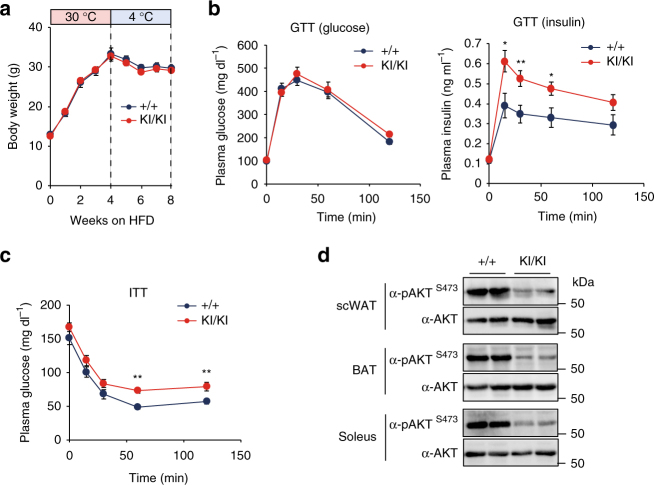
Insulin resistance phenotype of Jmjd1a-S265AKI/KI mice. a Body weight changes. WT (+/+) and Jmjd1a-S265AKI/KI mice (WT: n = 6; Jmjd1a-S265AKI/KI: n = 8) were fed on HFD for 4 weeks at 30 °C, and then switched to 4 °C for 4 weeks. b, c Glucose tolerance test (GTT) (b) and insulin tolerance test (ITT) (c) in each genotype group mice fed on HFD after cold acclimation in a (WT: n = 6; Jmjd1a-S265AKI/KI: n = 7). d Assessment of insulin signaling as quantified by the phosphorylation of AKT-S473 in scWAT, BAT, or soleus from each genotype mice fed on HFD after cold acclimation presented in a. Uncropped images of the blots are shown in Supplementary Fig. 8. Data are mean ± s.e.m. (a–c) Student’s t test was performed for comparisons in a–c. *P < 0.05 and **P < 0.01 were considered statistically significant

