Fig. 2.
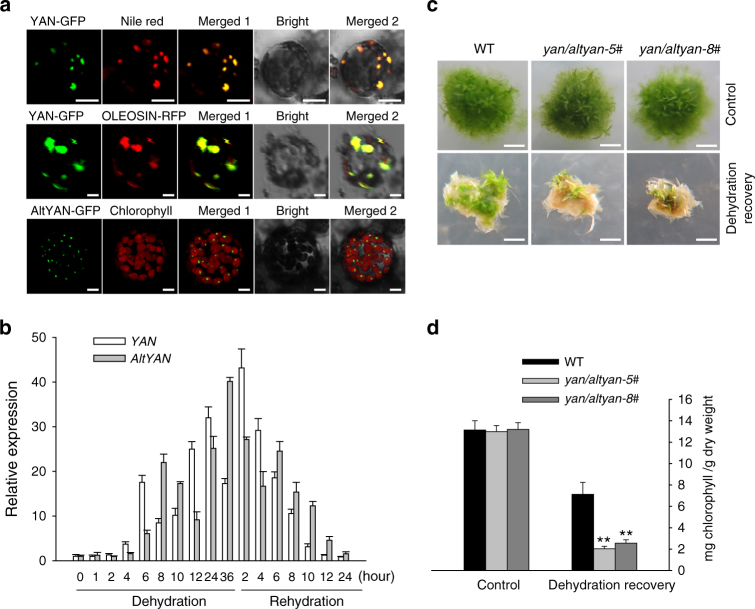
Protein subcellular localization and recovery of P. patens clones after dehydration treatments. a YAN is localized in oil bodies as indicated by the green fluorescence of YAN-GFP merged with Nile red and OLEOSIN-RFP (red), respectively. AltYAN-GFP is localized in chloroplasts as shown by the merged green fluorescence of AltYAN-GFP with chlorophyll auto-fluorescence (red). Scale bar = 4 μm. b Expression profile of YAN/AltYAN under dehydration and rehydration. Results represent means and standard deviations of three biological replicates for the wild-type plants. c Phenotypes of wild-type plants and yan/altyan mutants under control and dehydration treatments. Wild-type and yan/altyan plants were dehydrated for 20 h and transferred into sterile water for 1 h, and then transferred onto standard medium for recovery. Photos were taken after plants were recovered for 2 weeks. Scale bar = 2 mm. d Chlorophyll contents of wild-type and yan/altyan plants after 2 weeks of recovery. Results represent means and standard deviations of three biological replicates for the wild-type and two independent mutants. Double asterisks indicate a statistically significant difference compared with wild-type plants based on a two-tailed Student’s t test (p < 0.01)

