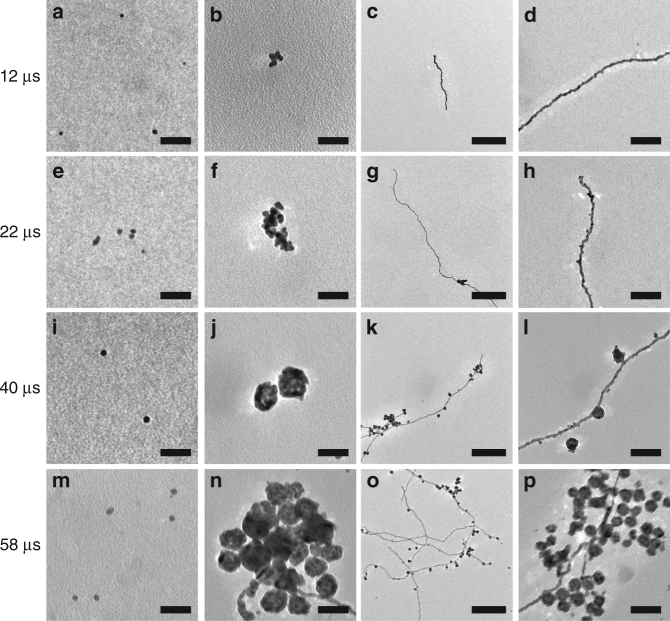
Fig. 4.
TEM images at different time points of AuNPs and AuNWs grown in the aqueous microdroplets. Time-course changes in the individual AuNPs (a, e, i, m), AuNP aggregates (b, f, j, n), and AuNWs (c, d, g, h, k, l, o, p). Scale bars for a, b, e, f, i, j, m, n are 40 nm. Scale bars for c, g, k, o are 80 nm. Scale bars for d, h, l, p are 80 nm

