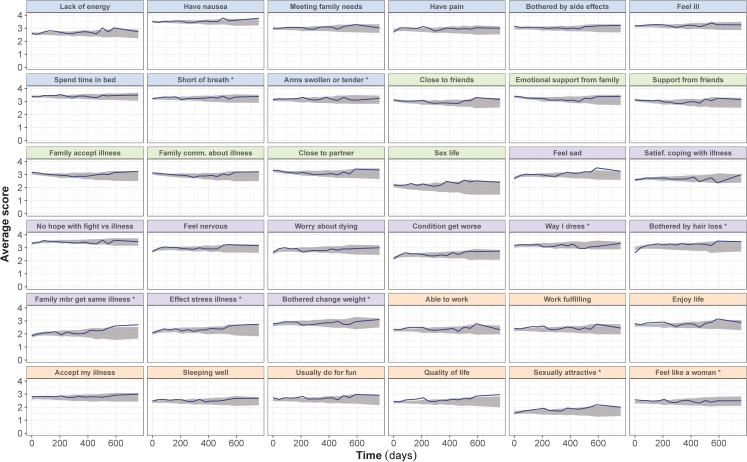
Fig. 2.
Visual predictive checks of the average score from the final longitudinal item response theory model, stratified by FACT-B items, in the ado-trastuzumab emtansine (T-DM1) arm. The observed average score (solid line) is compared to the 95% confidence interval (shaded area) of the average score over time, obtained from 200 simulations. Scores for reverse items have been reverse-scaled (i.e. higher score indicates better outcome). Panels’ color corresponds to the item subscale: blue for physical, green for social/family, purple for emotional and orange for functional. * Items originally belonging to the breast-cancer subscale.

