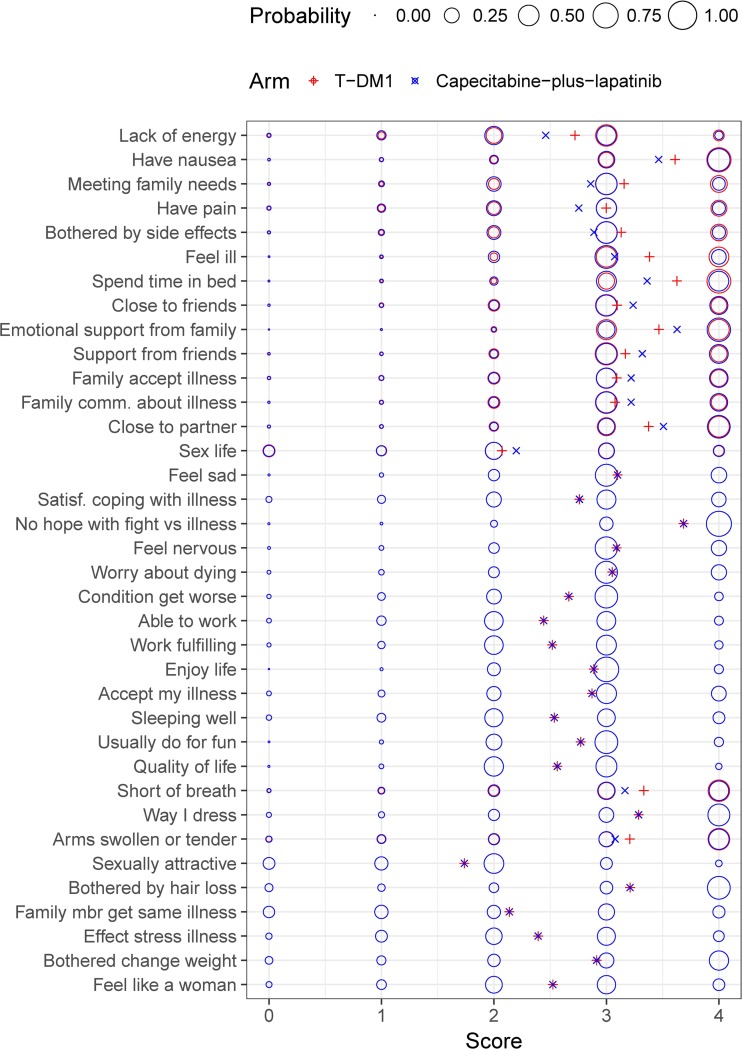
Fig. 5.
Schematic representation of the item score probabilities and expected score at steady-state for a typical non-Asian patient with baseline ECOG of 0, as predicted by the final longitudinal item-response theory model and differentiated by treatment arm. Circle surface areas are proportional to the score probability. Cross symbols represent expected scores, calculated as . Scores for reverse items have been reverse-scaled (i.e. higher score indicates better outcome). For items where no difference between treatment arms was identified, circles overlap and only one circle can be seen. T-DM1: ado-trastuzumab emtansine.

