Figure 4.
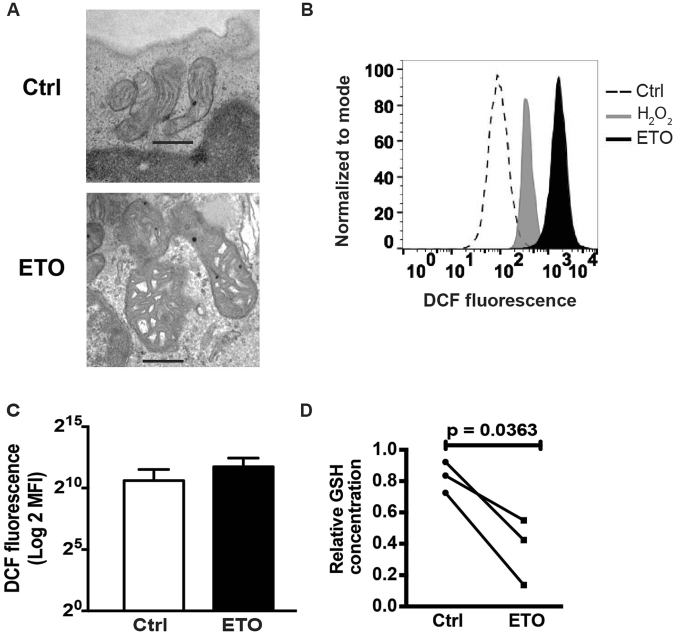
Commonly used concentrations of ETO induce severe oxidative stress in CD28-costimulated T cells. (A) Activated T cells were expanded in the presence of 50 μM until restdown. After thawing, these cells were processed for transmission electron microscopy. Representative images from two independent experiments are shown. Scale bars represent 500 nM. (B) ROS production in T cells treated with ETO for 4 hrs was measured by 2′,7′ dichlorofluorescein (DCF) fluorescence. Shown are the representative flow cytometry histograms (n = 5) of samples treated with either 50 μM H2O2 or 50 μM ETO. (C) Mean fluorescence intensities of cells treated with either control or ETO. (D) GSH levels of activated T cells treated with either control or 50 μM ETO over 5 days were quantified by LC-MS. Levels of reduced glutathione (Light) were assessed after normalizing to an isotopically-labeled standard (Heavy). The mean GSH levels ± SD were determined from triplicate measurements per condition in each experiment. Paired data (Ctrl vs ETO) from three individual experiments with separate donors are shown. GSH levels were decreased in ETO-treated T cells (Paired t-test analyses; *p < 0.05).

