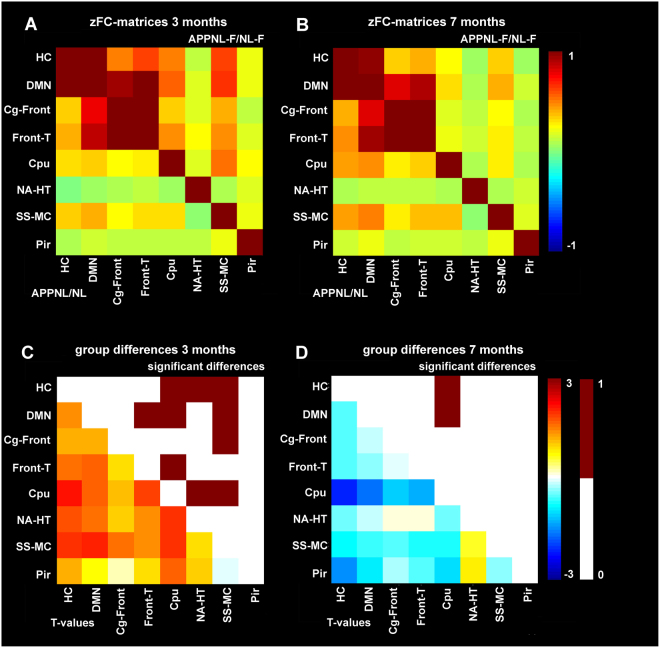
Figure 4.
BOLD FC within between networks. (A,B) zFC-matrices of 3 months (A) and 7 months (B) old APPNL/NL (lower half of the matrix) and APPNL-F/NL-F mice (upper half of the matrix). Color scale represents the z-score i.e. strength of FC between each pair of brain networks. (C,D) T-values representing the statistical group difference (lower half of the matrix) and binary matrix with statistically significant differences (upper half of the matrix) between APPNL/NL and APPNL-F/NL-F mice at 3 months (C) and 7 months of age (D). Color scale represents the T-values (twog-sample T-test). Abbreviations are listed in Table 1.

