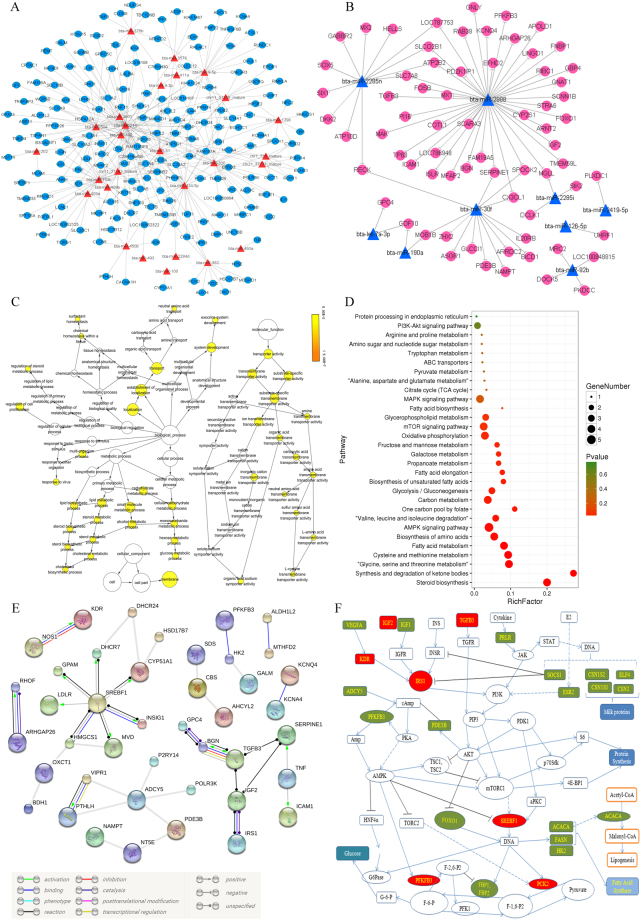
Figure 5.
Co-expression networks of DE miRNAs and mRNAs from the H group in comparison with the L group. (A) Red triangles represent up-regulated miRNAs, and blue circles represent down-regulated mRNAs. (B) Blue triangles represent down-regulated miRNAs, and red circles represent up-regulated mRNAs. (C) GO enrichment analysis of DE mRNAs in miRNA-mRNA pairs. The circle size represents the number of genes for each GO term, and the circle color represents the degree of GO term enrichment. (D) KEGG pathway enrichment analysis of DE mRNAs in miRNA-mRNA pairs. The circle size represents the number of genes for each pathway, and the circle color represents the degree of pathway enrichment. (E) Gene-Act network of DE mRNAs in miRNA-mRNA pairs according to the pathways in the STRING database. (F) Some of the biological pathways involved in milk protein and fat metabolism. The red and green boxes indicate genes DE in the H compared to the L group. The red boxes represent DEGs that may be targets of DE miRNAs.

