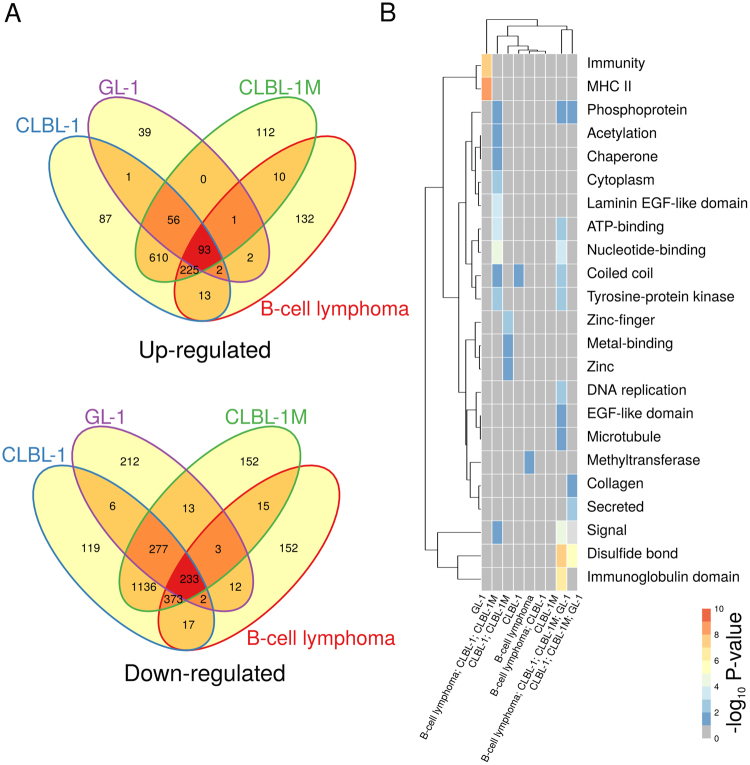
Figure 2.
Comparison between B-cell lymphomas and B-cell-derived lymphoid cell-line models. (A) Venn diagram of consistently significantly up- and down-regulated genes in B-cell lymphoma and B-cell-derived lymphoid cell line samples. (B) UniProt keywords significantly associated with genes that are differentially expressed in B-cell lymphomas and/or B-cell-derived lymphoid cell lines. All considered sets are disjoint. For example, “B-cell lymphoma; CLBL-1” corresponds to the set of genes that are differentially expressed exclusively in both B-cell lymphoma and CLBL-1 samples. The Database for Annotation, Visualization and Integrated Discovery57,58 (DAVID Bioinformatics Resources 6.8, http://david.abcc.ncifcrf.gov/) was used to test for statistical enrichment of a given UniProt keyword at a FDR ≤ 5% with the set of 17,950 genes represented in the dataset with at least one sequence read count as background. Two-way clustering was performed using the Euclidean distance metric using complete linkage for both columns and rows. Visualization was performed with the R/Bioconductor package pheatmap62. Heatmap shades represent the negative log10 of the adjusted P-value (FDR) of enrichment of a given gene set for association with the listed UniProt keyword.

