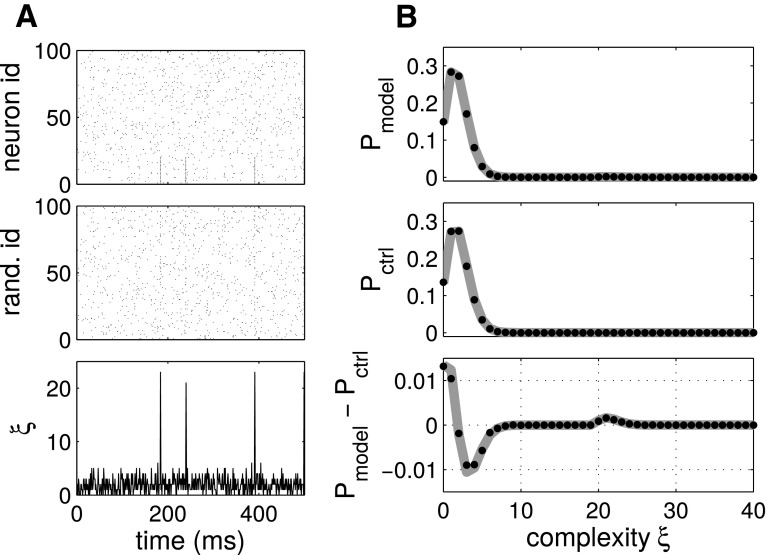
Fig. 2.
Complexity distribution based correlation identification. a Top Parallel spike trains comprising a synchronous spike events among the first 20 neurons, firing in synchrony with a rate of 1/s, plus 80 independent neurons. Middle randomization of the neuron ids (vertical axis) of the top panel. Bottom population histogram of the data (bin width: ). b Top Complexity distribution of the data in a. Middle null distribution obtained analytically (solid line) or by surrogates through spike time randomization in time (dots). Bottom difference between the observed and the null complexity distributions
(Reproduced with permission from Grün et al. 2008)

