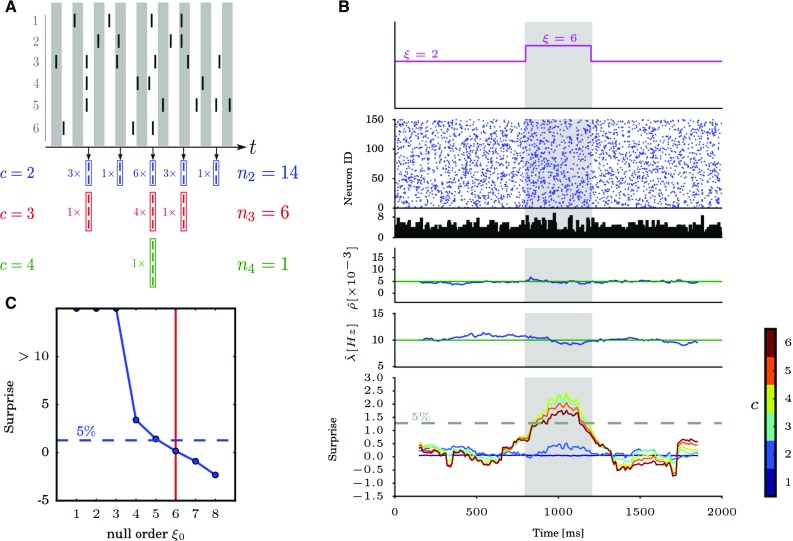
Fig. 4.

Population unitary event analysis. a Top: raster plot of 6 neurons firing over time. Bottom: illustrative example of the test statistic , showing for given values of c ( blue, red, green) and for each bin of the population histogram containing spikes, the number of patterns of size c that can be extracted from the spikes. b Time-resolved PUE analysis applied to simulated data. The simulated data consist of parallel spike trains with duration , generated as a realization of a correlated Poisson process of order in the time window (indicated in gray), and of order elsewhere. The firing rate of each individual spike train is set to and the pairwise correlation coefficient to 0.005. The data are analyzed with PUE varying the hyperparameter c from 1 to 6. From top to bottom: Time course of synchrony order , raster plot of the data, population histogram ( bin size), cross-neuron average of empirical pairwise correlation coefficients calculated over a sliding window, average firing rate estimated over the same sliding window, and surprise measure of the PUE statistic using different values of the parameter c. The surprise is calculated for each time window with null order . Different colors correspond to different values of c. The gray dashed line indicates the significance level. c Estimation of the synchronization order in the central analysis window (highlighted in gray in panel B), for a null order increasing from 1 to 8. The data are obtained by concatenating 15 model realizations generated as explained in B, and mimicking identically distributed experimental trials. The blue dashed line indicates the significance level and the vertical red line shows the true synchronization order
(Reproduced with permission from Rostami 2017)
