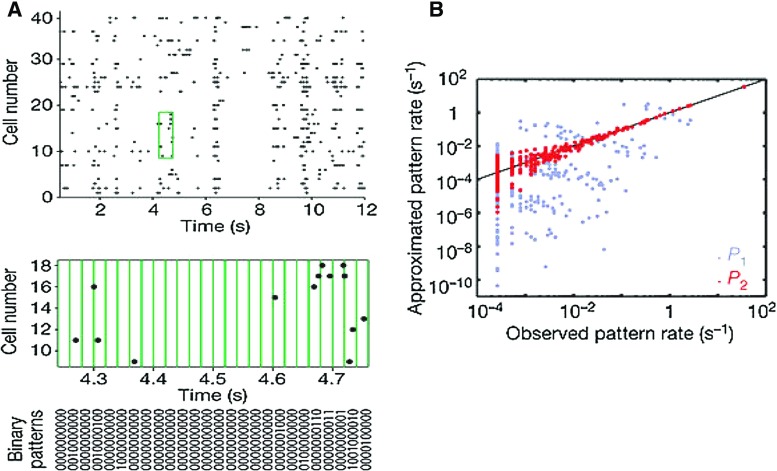
Fig. 5.
Maximum entropy models. a A segment of the simultaneous responses of 40 ganglion cells in the salamander retina to a natural movie clip (top panel). Discretization of parallel spike trains into binary patterns is shown below (green). The binary vectors describe the joint activity patterns of the cells at a given time point. For clarity, 10 out of 40 cells are shown (bottom panel). b Using the same group of 10 cells from panel a, the rate of occurrence of each firing pattern predicted from a maximum entropy model that takes into account all pairwise correlations is plotted against the pattern rate measured in the recorded data (red dots). For comparison, the independent model is also plotted in gray. The black line indicates equality
(Reproduced with permission from Schneidman et al. 2006)

