Figure 2.
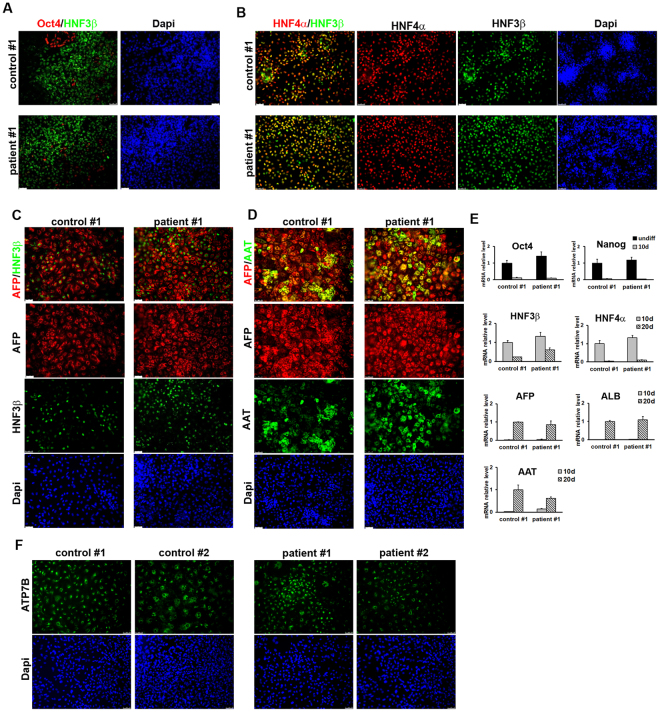
Characterization of HLCs obtained from control and patient iPSC clones. (A) One control and one patient iPSC clones shown in Fig. 1C were induced to differentiate into HLCs and after 5 days the achievement of endodermal phenotype was measured by immunofluorescence to visualize HNF3β protein expression. The parallel loss of the undifferentiated phenotype is proved by the disappearance of Oct4 positive cells. (B) After 10 days from HLC induction, hepatic specification of endodermal cells is reached by both control and patient cells as demonstrated by the high number of cells co-expressing HNF4α (hepatic progenitor marker) and HNF3β. (C) The differentiation of control and patient cells into the hepatic lineage was assessed at 15 days of HLC induction by immunofluorescence for the expression of the markers AFP and HNF3β. (D) Full hepatic differentiation was evaluated at 20 days by analyzing the presence of the functional hepatic marker AAT co-expressed with AFP. Scale bars: 50 µm. (E) the differentiation into HLCs was evaluated at the indicated time points by quantitative real-time PCR measuring the loss of the undifferentiated phenotype (Oct4 and Nanog) and the appearance of markers of the three hepatic developmental stages: definitive endoderm (HNF3β), hepatic progenitors (HNF3β, HNF4α, AFP) and hepatic-like cells (AFP, AAT). The graphs represent the mRNA relative expression of each marker normalized to the control clone levels. Data are reported as means ± SEM of at least three biological replicates. (F) Immunofluorescence analysis of the expression of ATP7B in HLCs derived from control and patient iPSCs. Scale bars: 50 µm.

