Figure 3.
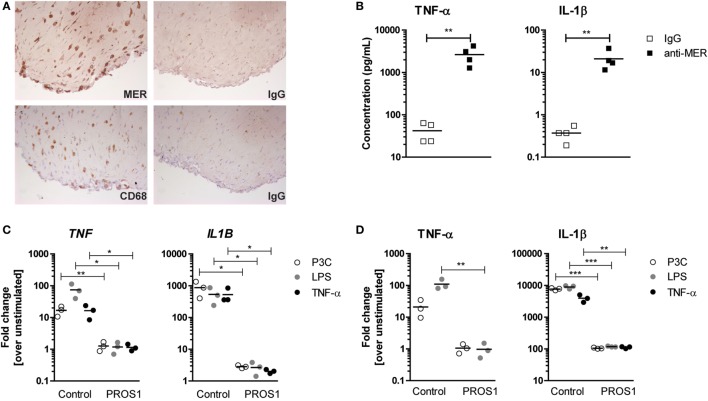
Production of pro-inflammatory cytokines by three-dimensional synovial micromasses after anti-MER or PROS1 treatment. (A) Micromasses were examined for their protein expression of MER and CD68 (macrophage marker). Shown are representative pictures and IgG controls. (B) Micromasses were treated with IgG or anti-MER for 24 h. Supernatants were examined for the presence of tumor necrosis factor alpha (TNF-α) and IL-1β (n = 4). (C) Micromasses were preincubated with 50 nM Pros1 for 24 h and stimulated with lipopolysaccharide (LPS) (100 ng/mL), P3C (100 ng/mL), or TNF-α (10 ng/mL) for 6 h. Messenger RNA was extracted and gene expression was determined (n = 3). (D) Micromasses were pre-incubated with 50 nM Pros1 for 24 h and stimulated with LPS (100 ng/mL), P3C (100 ng/mL), or TNF-α (10 ng/mL) for 24 h. Supernatants were analyzed (n = 3). All data are representative for two independent experiments. For (B–D), data are presented as dot-plots with mean. *p < 0.05, **p < 0.01, ***p < 0.001 with unpaired t-test. See also Figure S3 in Supplementary Material.

