Figure 6.
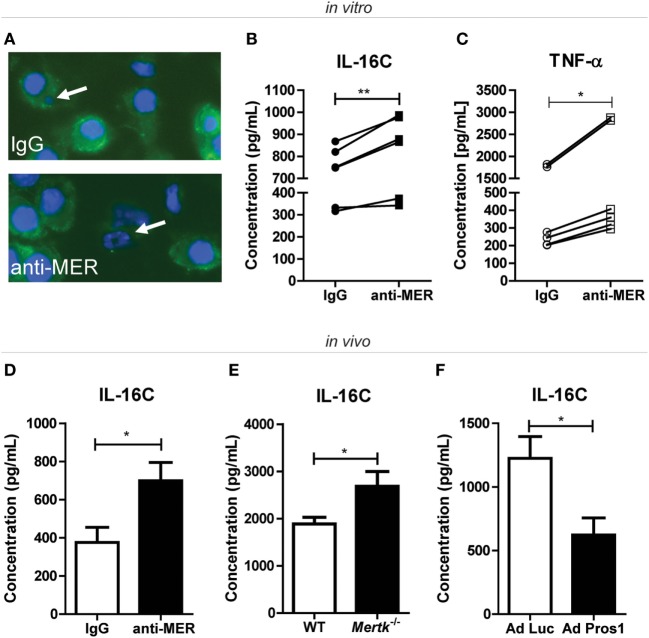
Assessment of secondary necrosis after treatment with MER-specific antibodies, Mertk gene ablation or Pros1 overexpression. (A) J774A.1 cells were incubated with IgG or anti-MER and cocultured with bone marrow neutrophils for 24 h. Cells were stained with F4/80 (green) and DAPI (blue). Representative pictures are shown for each group. White arrows indicate an engulfed cell (IgG group) or an apoptotic cell (anti-MER group). (B) J774A.1 cells were incubated with IgG or anti-MER and cocultured with bone marrow neutrophils for 48 h. Supernatants were examined for the presence of interleukin (IL)-16C (n = 6 individual experiments). (C) Supernatants of (B) were analyzed for the presence of tumor necrosis factor alpha (TNF-α) (n = 6 individual experiments). (D) Serum samples from collagen-induced arthritis (CIA) mice systemically treated with IgG or anti-MER were analyzed for IL-16C (n = 10–11 mice). (E) Serum samples from wild-type (WT) or Mertk−/− mice with KRN serum transfer arthritis were analyzed for IL-16C (n = 9–15 mice). (F) Serum samples from mice with CIA intravenously injected with Ad Luc or Ad Pros1 were analyzed for IL-16C (n = 7–8 mice). For (B,C), data are presented as dot-plots. *p < 0.05, **p < 0.01 with paired t-test. For (D–F), data are presented as mean + SEM. *p < 0.05 with unpaired t-test. See also Figure S5 in Supplementary Material.

