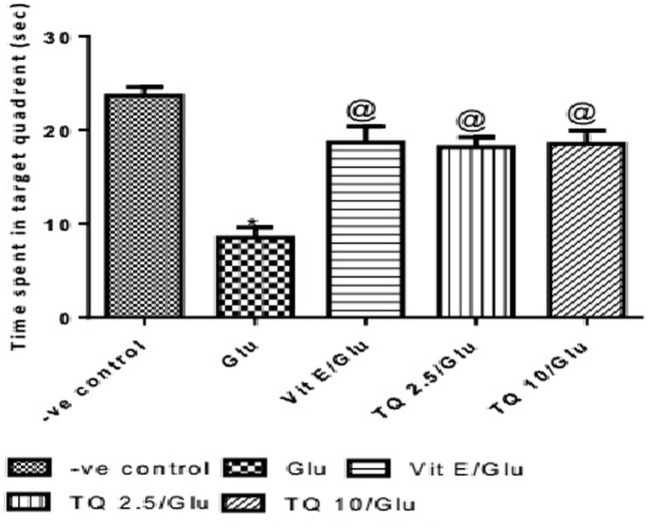
Figure 8.
Effect of −ve control, Glu, Vit E/Glu, TQ2.5/Glu, and TQ10/Glu on Aβ(1–42) levels. Glu was injected i.p. as a single dose for 7 days. TQ and Vit E were injected as a single dose for 7 days. Each value represents the mean value of 12 rats ± SEM. Statistics were carried out by one-way ANOVA followed by Tukey’s multiple comparison tests, by graph pad prism 5. *Statistically significant from −ve control group (p < 0.05); @statistically significant from Glu group (p < 0.05); #statistically significant from Vit E/Glu group (p < 0.05); Xstatistically significant from TQ 2.5/Glu group (p < 0.05).

