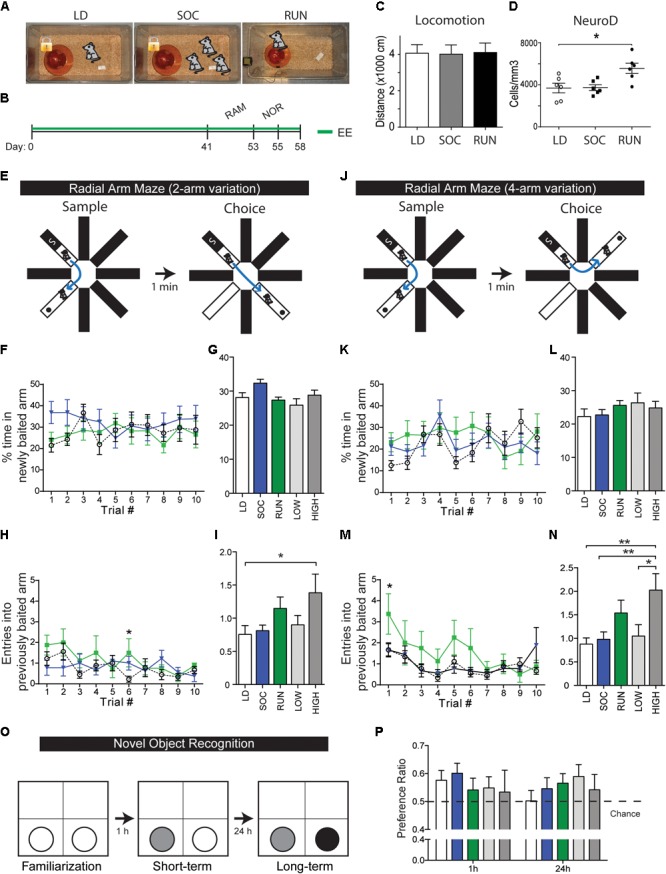
FIGURE 1.

Behavioral testing of environmentally enriched mice. (A) EE groups. (B) Timeline of experiment. Mice spent 41 days housed in their respective enriched environments, then spent another additional 14 days undergoing behavioral testing in the radial arm maze (RAM, 12 days) and novel object recognition test (NOR, 2 days). Enriched environments were maintained during the testing period, and animals were sacrificed for tissue analysis 3 days following the testing period. (C) Quantification of open field locomotor activity. Note that there are no differences in baseline locomotion. (D) Quantifications of NeuroD+ neuroblasts within the DG at the end of the behavioral experiment. Note that NeuroD+ neuroblasts were unchanged between LD and SOC groups (p = 0.9633) and were significantly increased in the RUN group (p = 0.0117 versus LD). One-way ANOVA. (E–N) Radial arm maze. Illustrations of the 2- and 4-arm variations of the maze test (E,J). % time in newly baited arm, shown plotted daily (F,K) or as an average over the 10-day period (G,L), n = 14–15/group from two cohorts. Entries into previously baited arm, shown plotted daily (H,M) or as an average over the 10-day period (I,N), n = 8–9/group from one cohort. Note that high-distance runners show a significant increase in mean entries in both arm variations (2-arm: LD vs. HIGH p = 0.0288, 4-arm: LD vs. HIGH p = 0.0013, SOC vs. HIGH p = 0.0046, LOW vs. HIGH p = 0.0452). Two-way ANOVA (F,H,K,M) and one-way ANOVA (G,I,L,N). (O,P) Novel object recognition. Illustration of object changes during the familiarization, short-term memory, and long-term memory phases of the test (O). Preference ratios, defined as proportion of time spent with the new object, at the short-term and long-term memory testing phases (P), n = 14–15/group. ∗P ≤ 0.05; ∗∗P ≤ 0.01.
