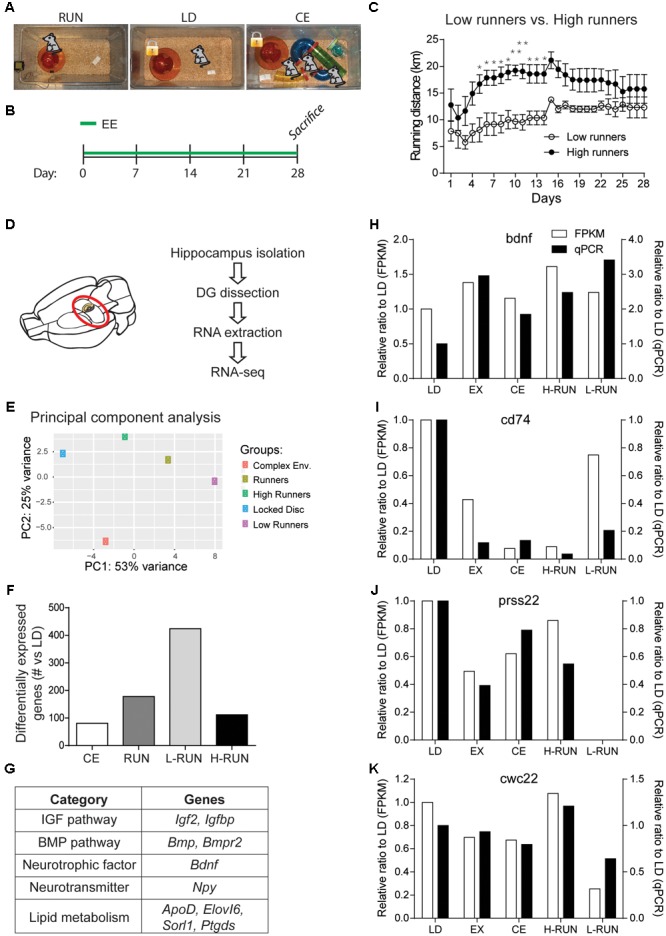
FIGURE 2.

Design and validation of the RNA-Seq paradigm. (A) EE groups. (B) Timeline of experiment. (C) Daily running distances of the low runners and high runners. (D) Schematic of the RNA-Seq experiment. (E) Principal component analysis (PCA) of the top 5000 varying genes. Two components were sufficient to separate the five conditions. (F) Number of significantly modulated genes per group (vs. LD) at a cut-off of log2(0.3). (G) Table of several known running-induced genes that are significantly modulated in one or more of the running groups. Comparison of the changes measured by RNA-Seq versus qPCR for four genes, BDNF (H), CD74 (I), Prss22 (J), and Cwc22 (K). RNA used for the qPCR measurements was obtained from the contralateral DG of the animals used for RNA-Seq. ∗P ≤ 0.05; ∗∗P ≤ 0.01.
