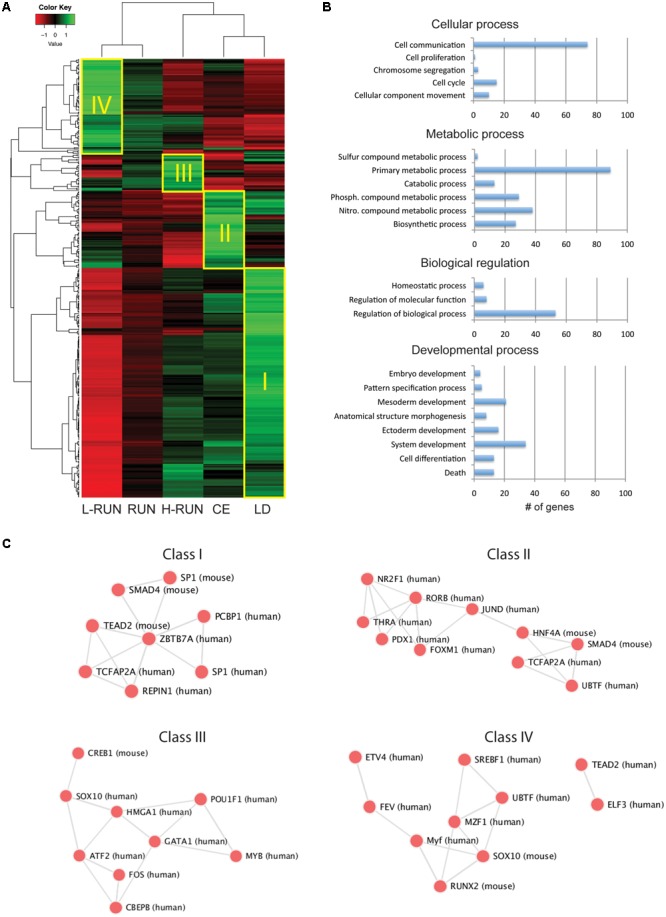
FIGURE 3.

Overview of EE-induced transcriptomic changes. (A) Z-score heatmap of the 380 genes having at least a 1.4-fold difference across any two groups. Hierarchical clustering identifies four large classes of co-regulated genes (I–IV), which are preferentially expressed in the LD (Class I), CE (Class II), H-RUN (Class III), or L-RUN (Class IV) experimental groups. (B) The top four GO Biological Processes represented within the above 380 genes. Shown are the number of genes found within each sub-category of the top four GO Biological Processes. (C) Transcription factor networks associated with the Classes I–IV groups of co-regulated genes.
