
FIGURE 6.
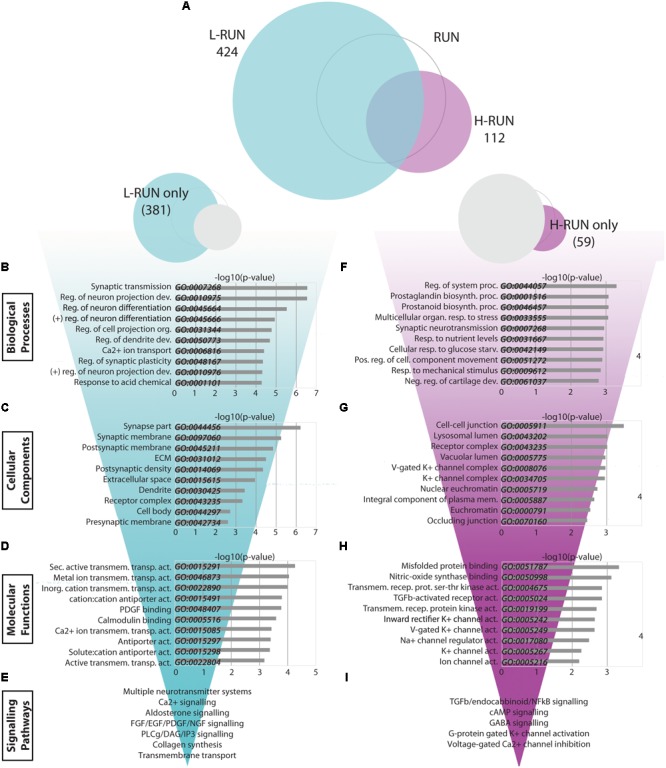
Transcriptomic changes specific to low runners and high runners. (A) Venn diagrams showing the relationship between significantly modulated genes in the L-RUN and H-RUN groups, focusing on the genes that were L-RUN-specific and H-RUN-specific. (B–I) Bio-informatic analyses of modulated genes in the L-RUN group (B–E) and H-RUN group (F–I) were performed by gene set enrichment analysis for GO Biological Processes (B,F), GO Cellular Components (C,G), GO Molecular Functions (D,H), and KEGG and Reactome pathways (E,I). For each of the GO categories, the top 10 enriched gene sets are shown plotted against their –log10(p-value). Supplementary Table S3: Spreadsheet of the most modulated genes for the L-RUN environment versus the LD control. Supplementary Table S4: Spreadsheet of the most modulated genes for the H-RUN environment versus the LD control.