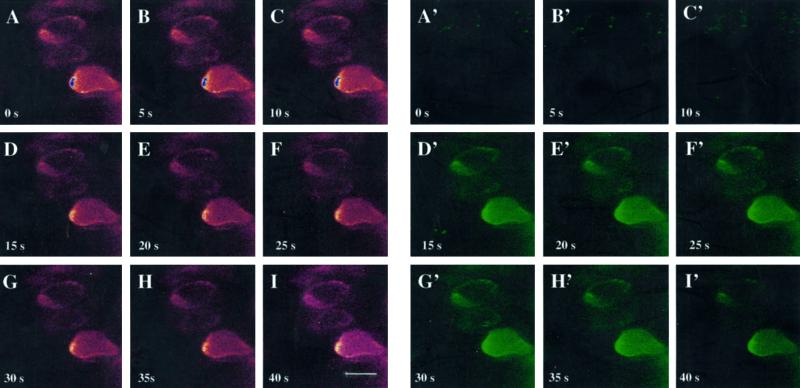
Figure 3.
Confocal time-based series of images showing Ca2+ homeostasis when fura-2 loaded PEMs in MS2 (MS + 1 mg/L 2,4-D) are perfused with MS3 (MS + 2% [v/v] mannitol). A through I represent the free-dye fluorescence obtained by excitation at 361 nm from 0 time point of perfusion with MS3; A′ through I′ represent the Ca2+-bound dye fluorescence obtained by excitation at 351 nm at identical time points. Negligible fluorescence in A′ through C′ indicates the low resting [Ca2+]cyt in pro-embryogenic cells for few seconds after perfusion with MS3 medium. Intense fluorescence in D′ represents an influx of Ca2+ into the cytosol, which gradually decreases with time (E′–I′). Scale bars = 15 μm.

