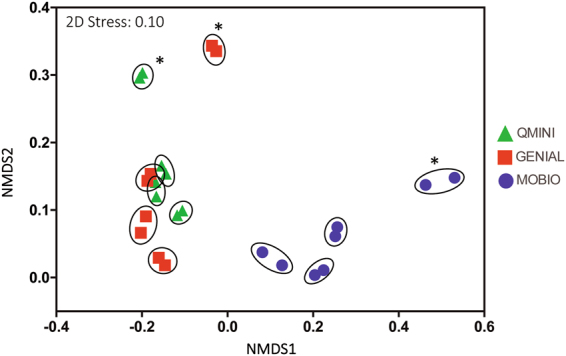
Figure 2.

Clustering of samples amplified with two different polymerases on a non-metric multidimensional scaling (NMDS) plot of the Bray-Curtis dissimilarities. Points are colored by applied extraction kit. The encircled pairs correspond to a single sample where each data point represents one 16 S rRNA amplification with Phusion Hot Start II High-Fidelity DNA Polymerase and the another with Platinum SuperFi DNA Polymerase. Sample pairs labeled with * were stored in PBS.
