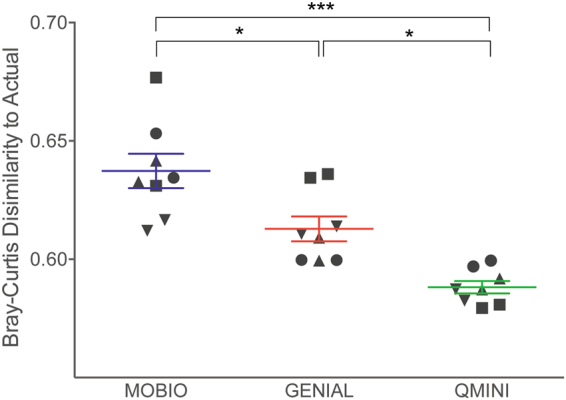
Figure 4.

Bray-Curtis dissimilarity between observed and expected strain proportion for each of the tested extraction methods. The expected strain proportion (actual) was generated for comparison and represents the theoretically composition of the mock community (see methods for detail). The pair-wise proportions (expected to observed) from samples extracted with the same commercial kit were grouped in a single boxplot (mean ± SEM). Symbols illustrate different buffer types (■ PBS, ▼RNA-later, ▲native, ●lysis buffer) (Paired t-test, *p < 0.05, ***p < 0.001).
