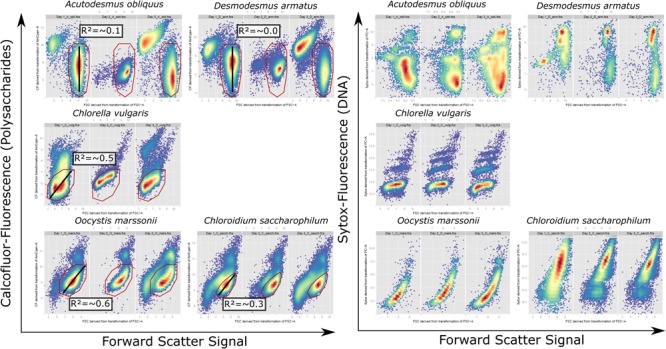
FIGURE 2.

Cytometric pattern for FSC signal against Calcofluor fluorescence signal of vital cells and FSC-Signal against Sytox fluorescence signal of fixed cells for A. obliquus, D. armatus, C. vulgaris, O. marssonii, and C. saccharophilum from representative exemplary control cultures on day 1, 2, and 3. Bottom-right, high density population, was used for correlation of single cell values for FSC signal against Calcofluor fluorescence (red gate). Black line indicates the respective regression line and the mean regression coefficient for measurements over 1 week is given in the respective box.
