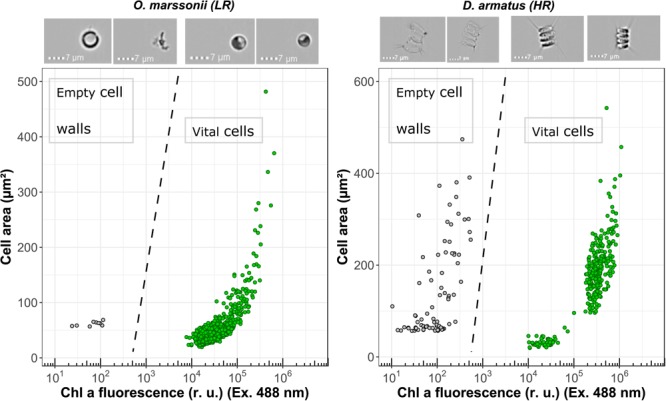
FIGURE 3.

Flow cytometric measurements of Chl a fluorescence (Excitation 488 nm) and cell surface area for O. marssonii and D. armatus. Accumulation of enzymatic resistant empty cell walls is demonstrated by the population on the upper left-hand side. Representative microscopic pictures for the respective populations are placed on the top of the cytogram.
