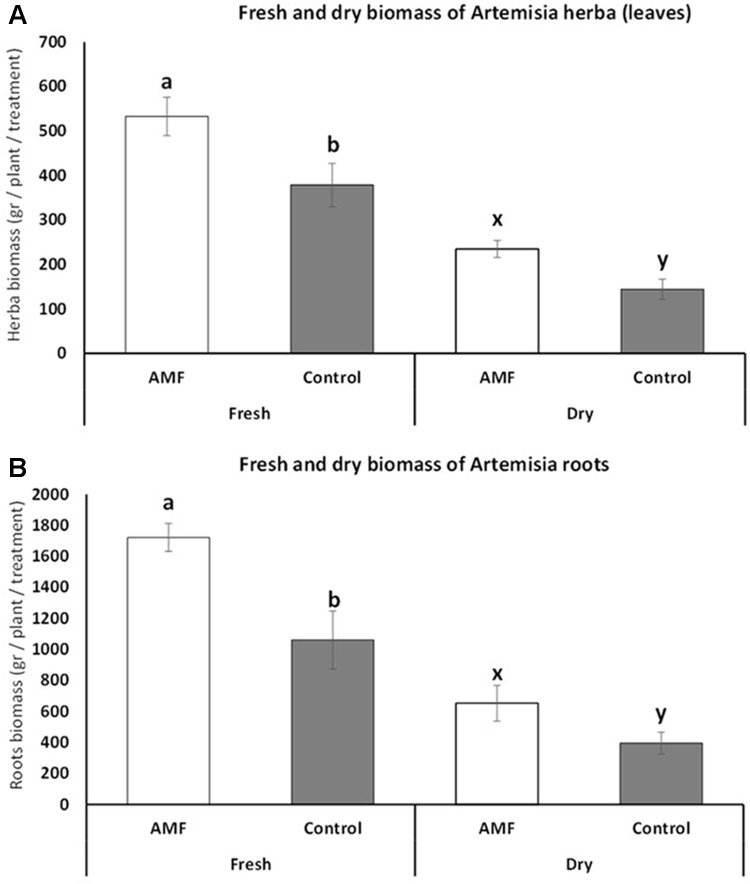
FIGURE 3.
Fresh and dry biomass of Artemisia annua herba (A) and roots (B) under AMF colonization (white bars) and control (without AMF) (gray bars) during the vegetation period (July). t-Test following the Student’s t-distribution were used to compare variables. Different letters means statistical significant differences at p < 0.01 level. Error bars = ± 1 standard error. Data at harvest showed almost the same trend, therefore no additional figures were presented.

