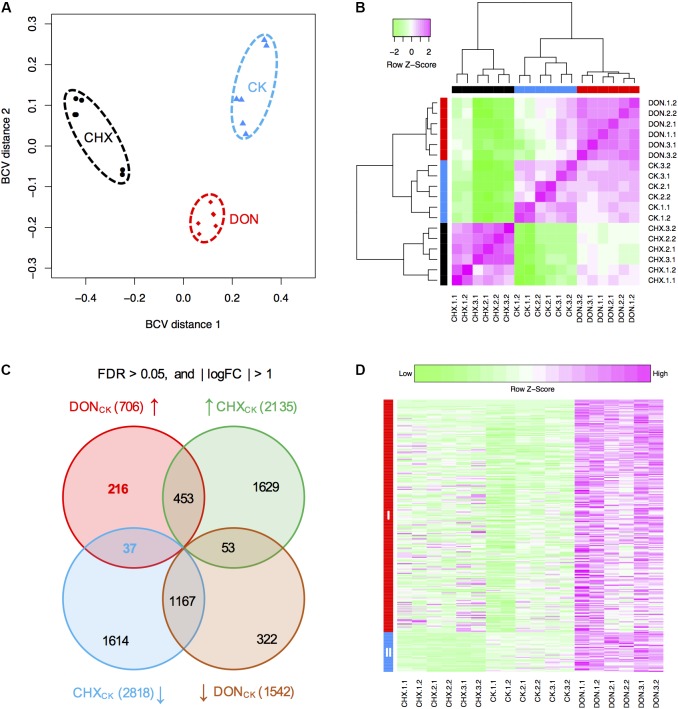
FIGURE 3.
RNA-seq analysis of the tri5–12–tri101 mutant. (A) Multidimensional scaling plot of the transcriptome profiles of the tri5–12–tri101 mutant treated with DON, CHX, or untreated (CK). (B) Hierarchical clustering analysis showing the relationship of the gene expression among different samples according to RNA-seq analysis. In (A) and (B), the untreated tri5–12–tri101 mutant, the mutant treated with DON, or CHX are marked in blue, red, or black, respectively. Each sample contains six replicates, including three biological replicates, and each biological replicate has two technical replicates. (C) Comparison of the differentially expressed genes in tri5–12–tri101 mutant treated with DON or CHX. The genes upregulated in DON (in red) and CHX (in green) treatments, and the genes downregulated in DON (in blue) and CHX (in orange) treatments are illustrated in the Venn diagram. Up arrows indicate upregulation, while the down arrows indicate downregulation. (D) Heatmap showing the expression patterns of the 253 specifically induced genes in the tri5–12–tri101 mutant upon DON treatment. Genes in class I (in red) are upregulated upon DON treatment. Genes in class II (in blue) are upregulated upon DON treatment, but downregulated upon CHX treatment.

