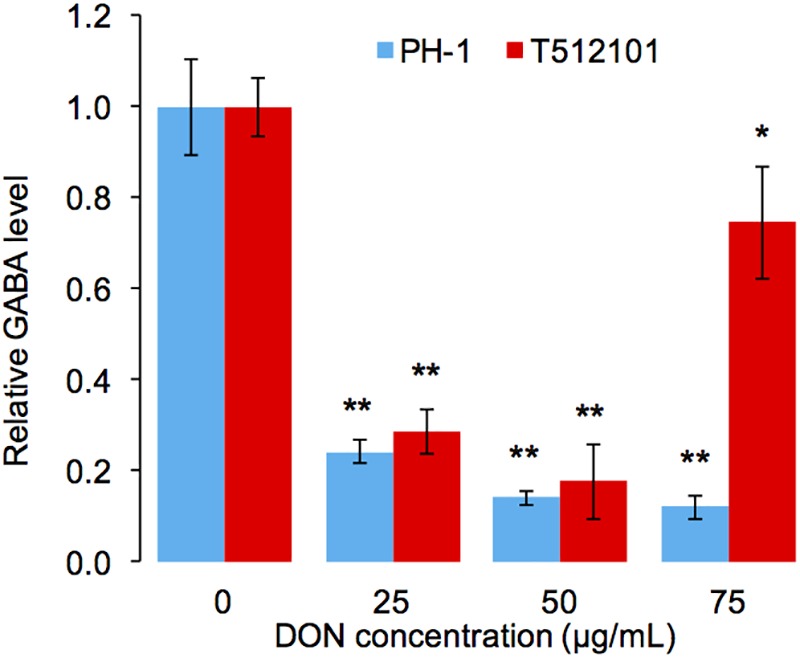
FIGURE 6.

Relative accumulation level of GABA in F. graminearum. The level of GABA was normalized to the untreated mycelia (0 μg/mL). Error bars represent the SD of three technical replicates. One-sided t-tests were used to access the significances between DON treated and untreated samples, “∗” stands for P-value < 0.05, and “∗∗” stands for P-value < 0.01.
